Available from version: 7 and above
Use What-If Analysis to test how a result changes when the assumptions behind it change. Excel-like Tables supports two What-If Analysis tools:
|
Tool |
Use it when |
|---|---|
|
Data Table |
You want to compare one result across a range of input values. |
|
Goal Seek |
You know the result you want and need to find the input value that produces it. |
Where to find it
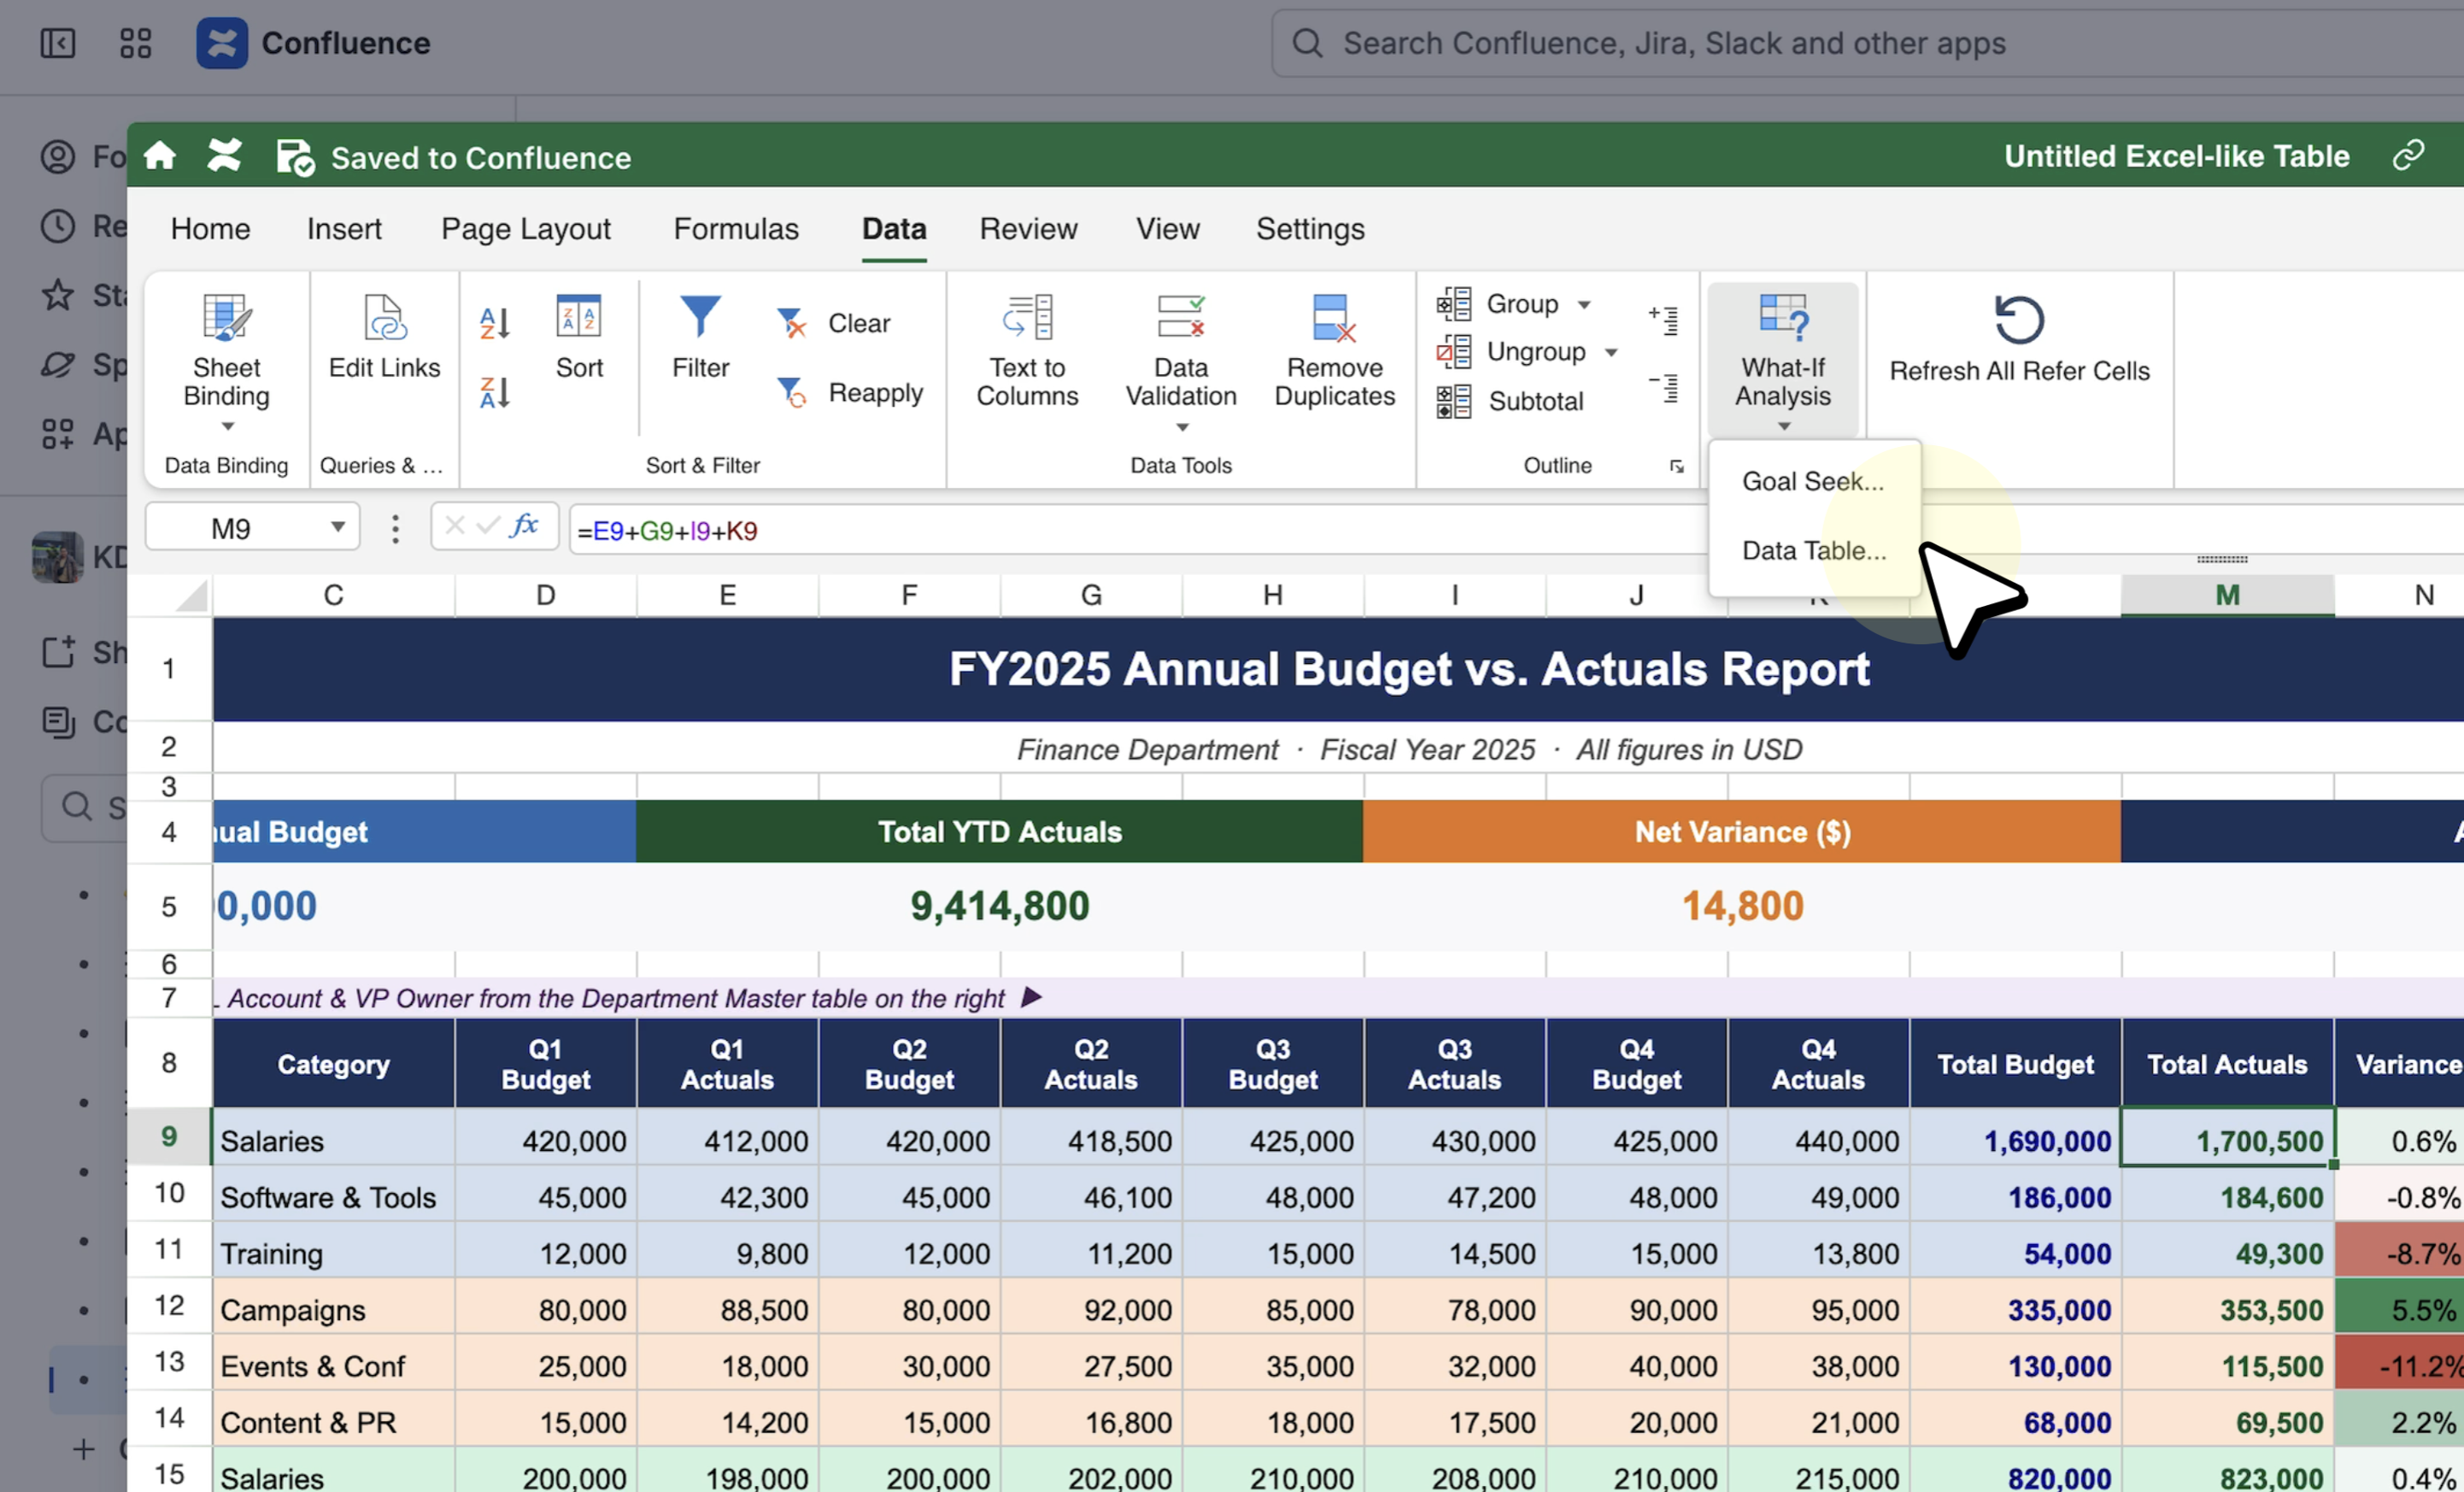
Open the table in the full-featured editor. Go to the Data tab, then select What-If Analysis in the Forecast group.
The sample
Download Helio2WhatIfAnalysis.xlsx and upload it into an Excel-like table to follow both examples.
The sample shows a product launch that doesn't add up: 8,000 units at $120 with a 10% discount, a price of $62 per unit, and $460,000 in fixed and marketing spend.
Operating profit in B19 is -$92,000. You must change an assumption to reach profit or break even
Data Table
The question: Marketing wants a launch discount of up to 25%. How much discount can the launch absorb at each price point?
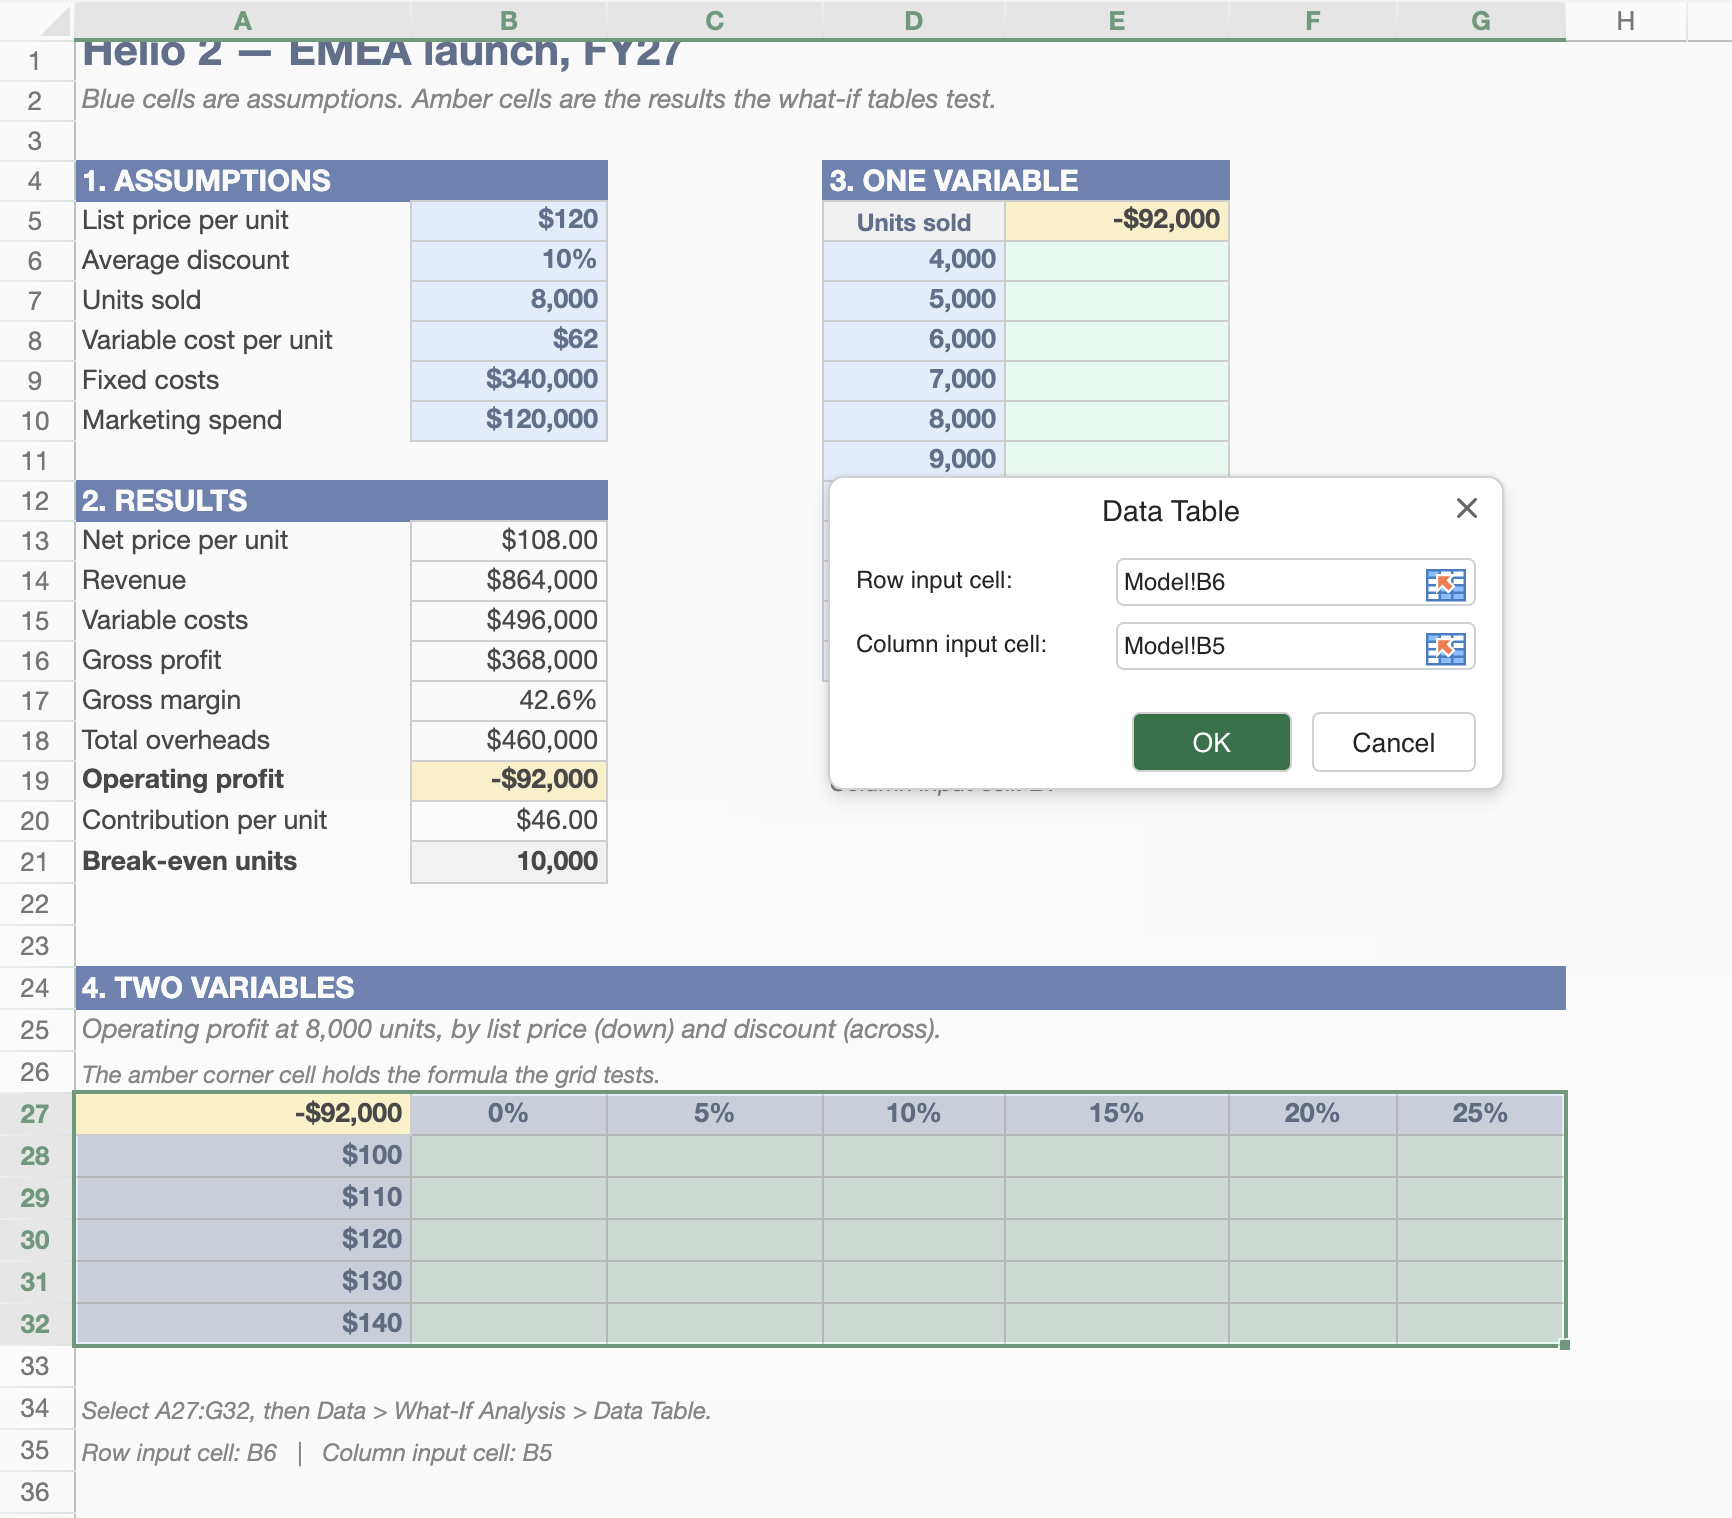
The sample already has the analysis block laid out: discounts across B27:G27, prices down A28:A32, an empty grid between them, and the amber corner cell A27 holding =B19, the profit being tested.
-
Select
A27:G32, including the amber corner cell. -
Go to Data > What-If Analysis > Data Table.
-
Set Row input cell to
B6, the discount, because discounts run across the top row. -
Set Column input cell to
B5, the list price, because prices run down the side. -
-
Click OK.
Observe the output:
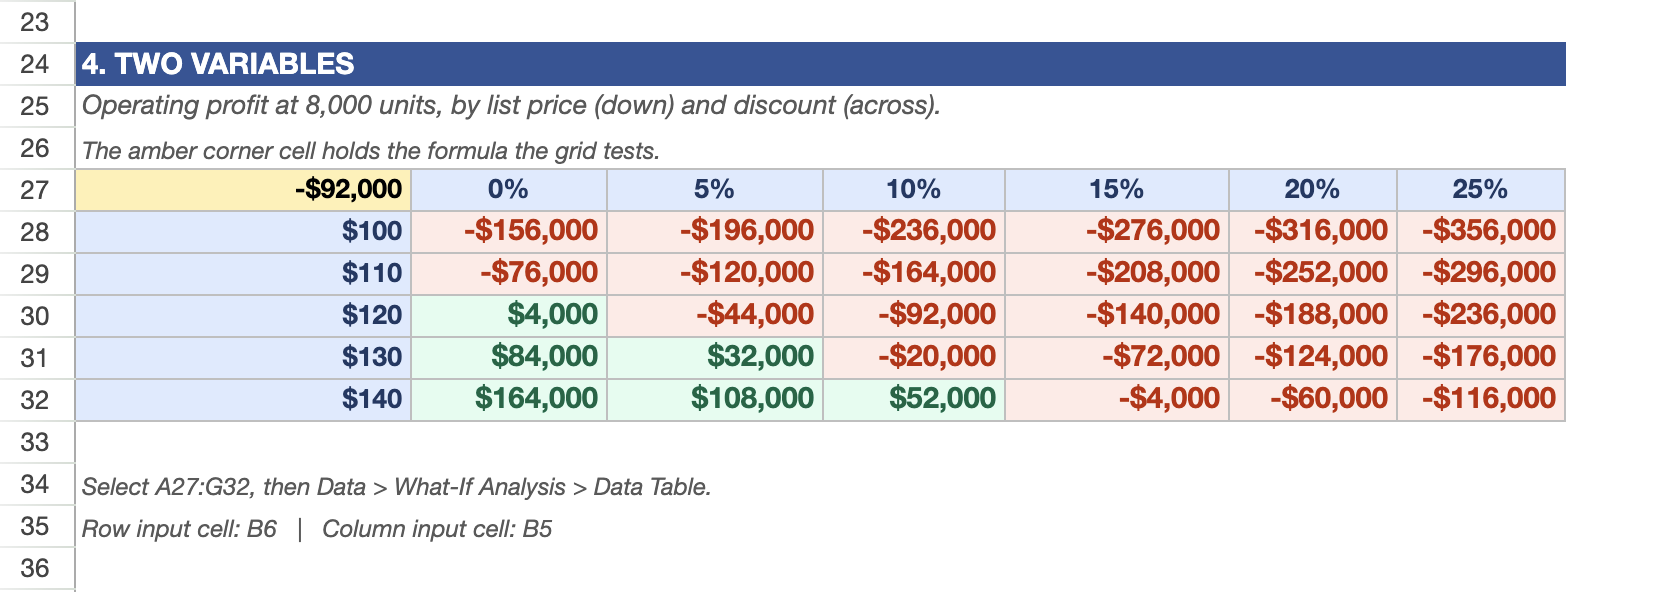
The answer: Only six of the thirty combinations make money. At $120, the launch works only with no discount. At $140, there is room for a 10% discount.
Tip: An input cell is where a value goes, not where it comes from. In the dialog, select the assumption cell that the values should replace, not the list of values. Input cells always sit outside the range you selected.
Goal Seek
The question: The current operating profit is -$92,000. To break even, how many units must be sold?
-
Go to Data > What-If Analysis > Goal Seek.
-
Set Set cell to
B19, operating profit. -
Set To value to
0. -
Set By changing cell to
B7, units sold.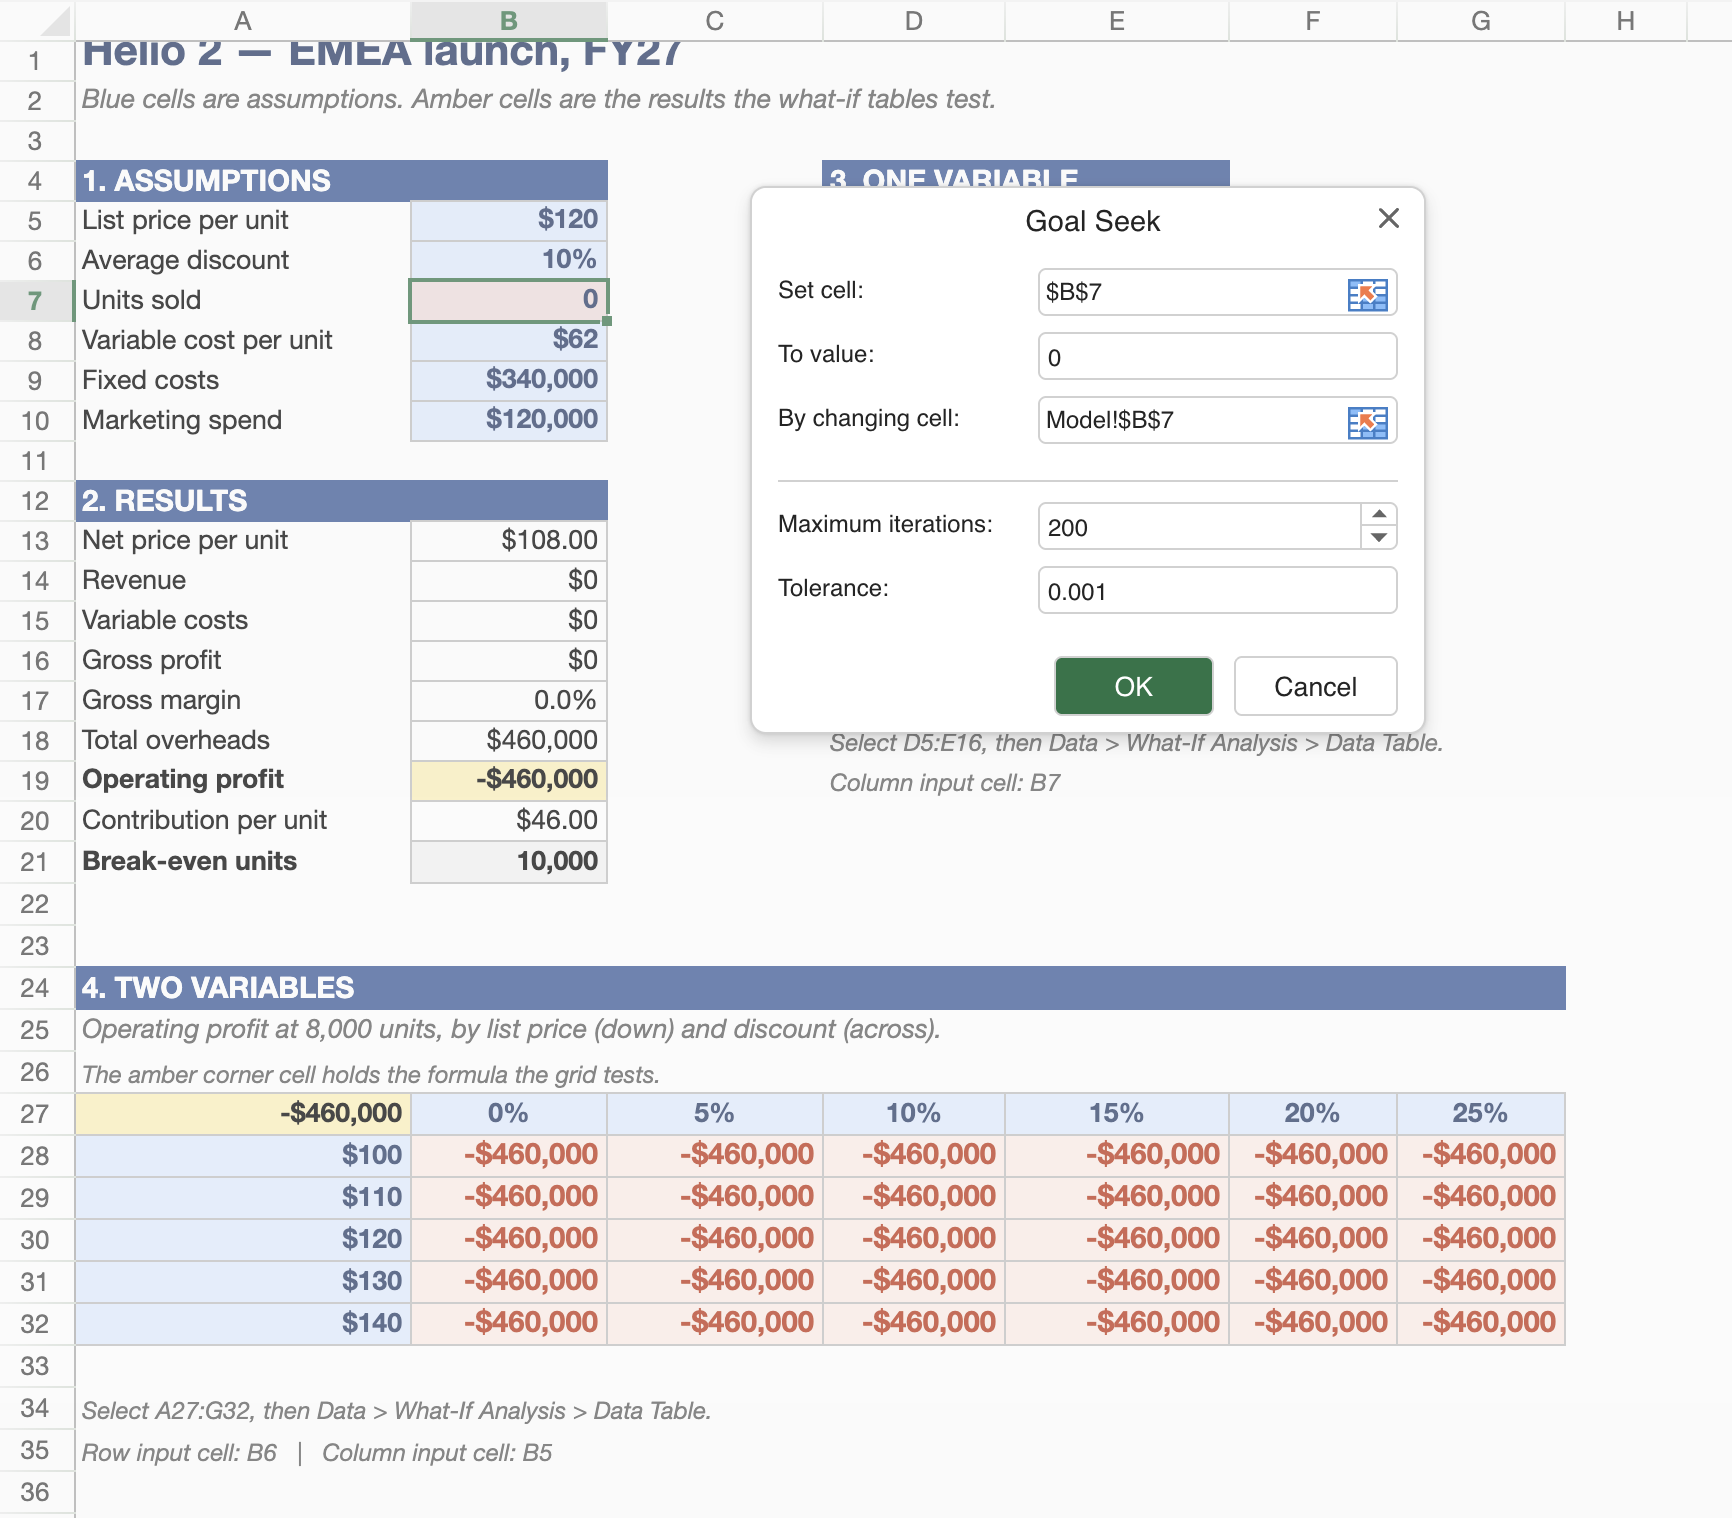
-
Click OK.
Observe the output:
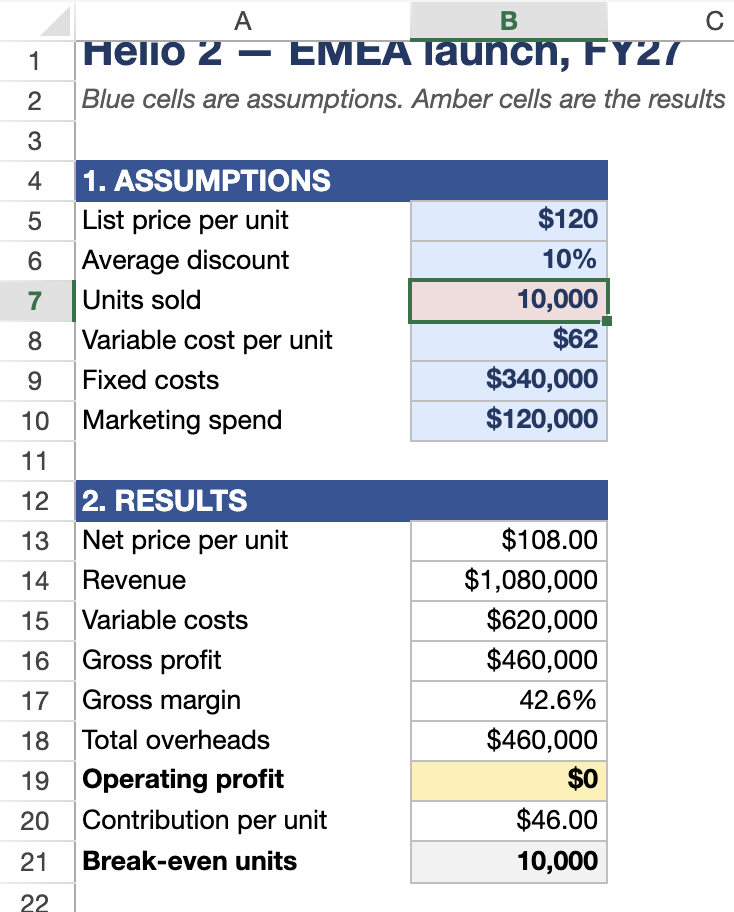
The answer: Units sold becomes 10,000, and operating profit becomes $0.
Important: Goal Seek writes the answer back into your model instead of filling a separate table. Note the value, then undo the change if you want to restore your original assumptions. Goal Seek solves for one input at a time. To compare two inputs, use a Data Table.
Share What-If Analysis results while you keep editing
What-If Analysis is often still in progress when stakeholders ask for an update. Excerpt macros let you share the current result on another Confluence page while you continue editing the source table. This is useful for executive summaries, project updates, and presentation pages that need the latest numbers without manual copy-paste updates.
Why this is useful: You can keep adjusting the source table, chart, or single value while stakeholders view the selected result somewhere else.
-
Share early: Give stakeholders visibility before the analysis is final.
-
Stay synced: When the source data changes, the excerpted result updates where it is displayed.
-
Avoid duplicate work: You do not need to update a separate presentation or planning page every time the numbers change.
Choose the right excerpt:
-
Use Excerpt Range to share a selected table range.
-
Use Excerpt Chart to share a visual chart.
-
Use Excerpt Single Cell to publish one key metric.
For the full overview, see Excerpt Macro.
Select the result you want to excerpt
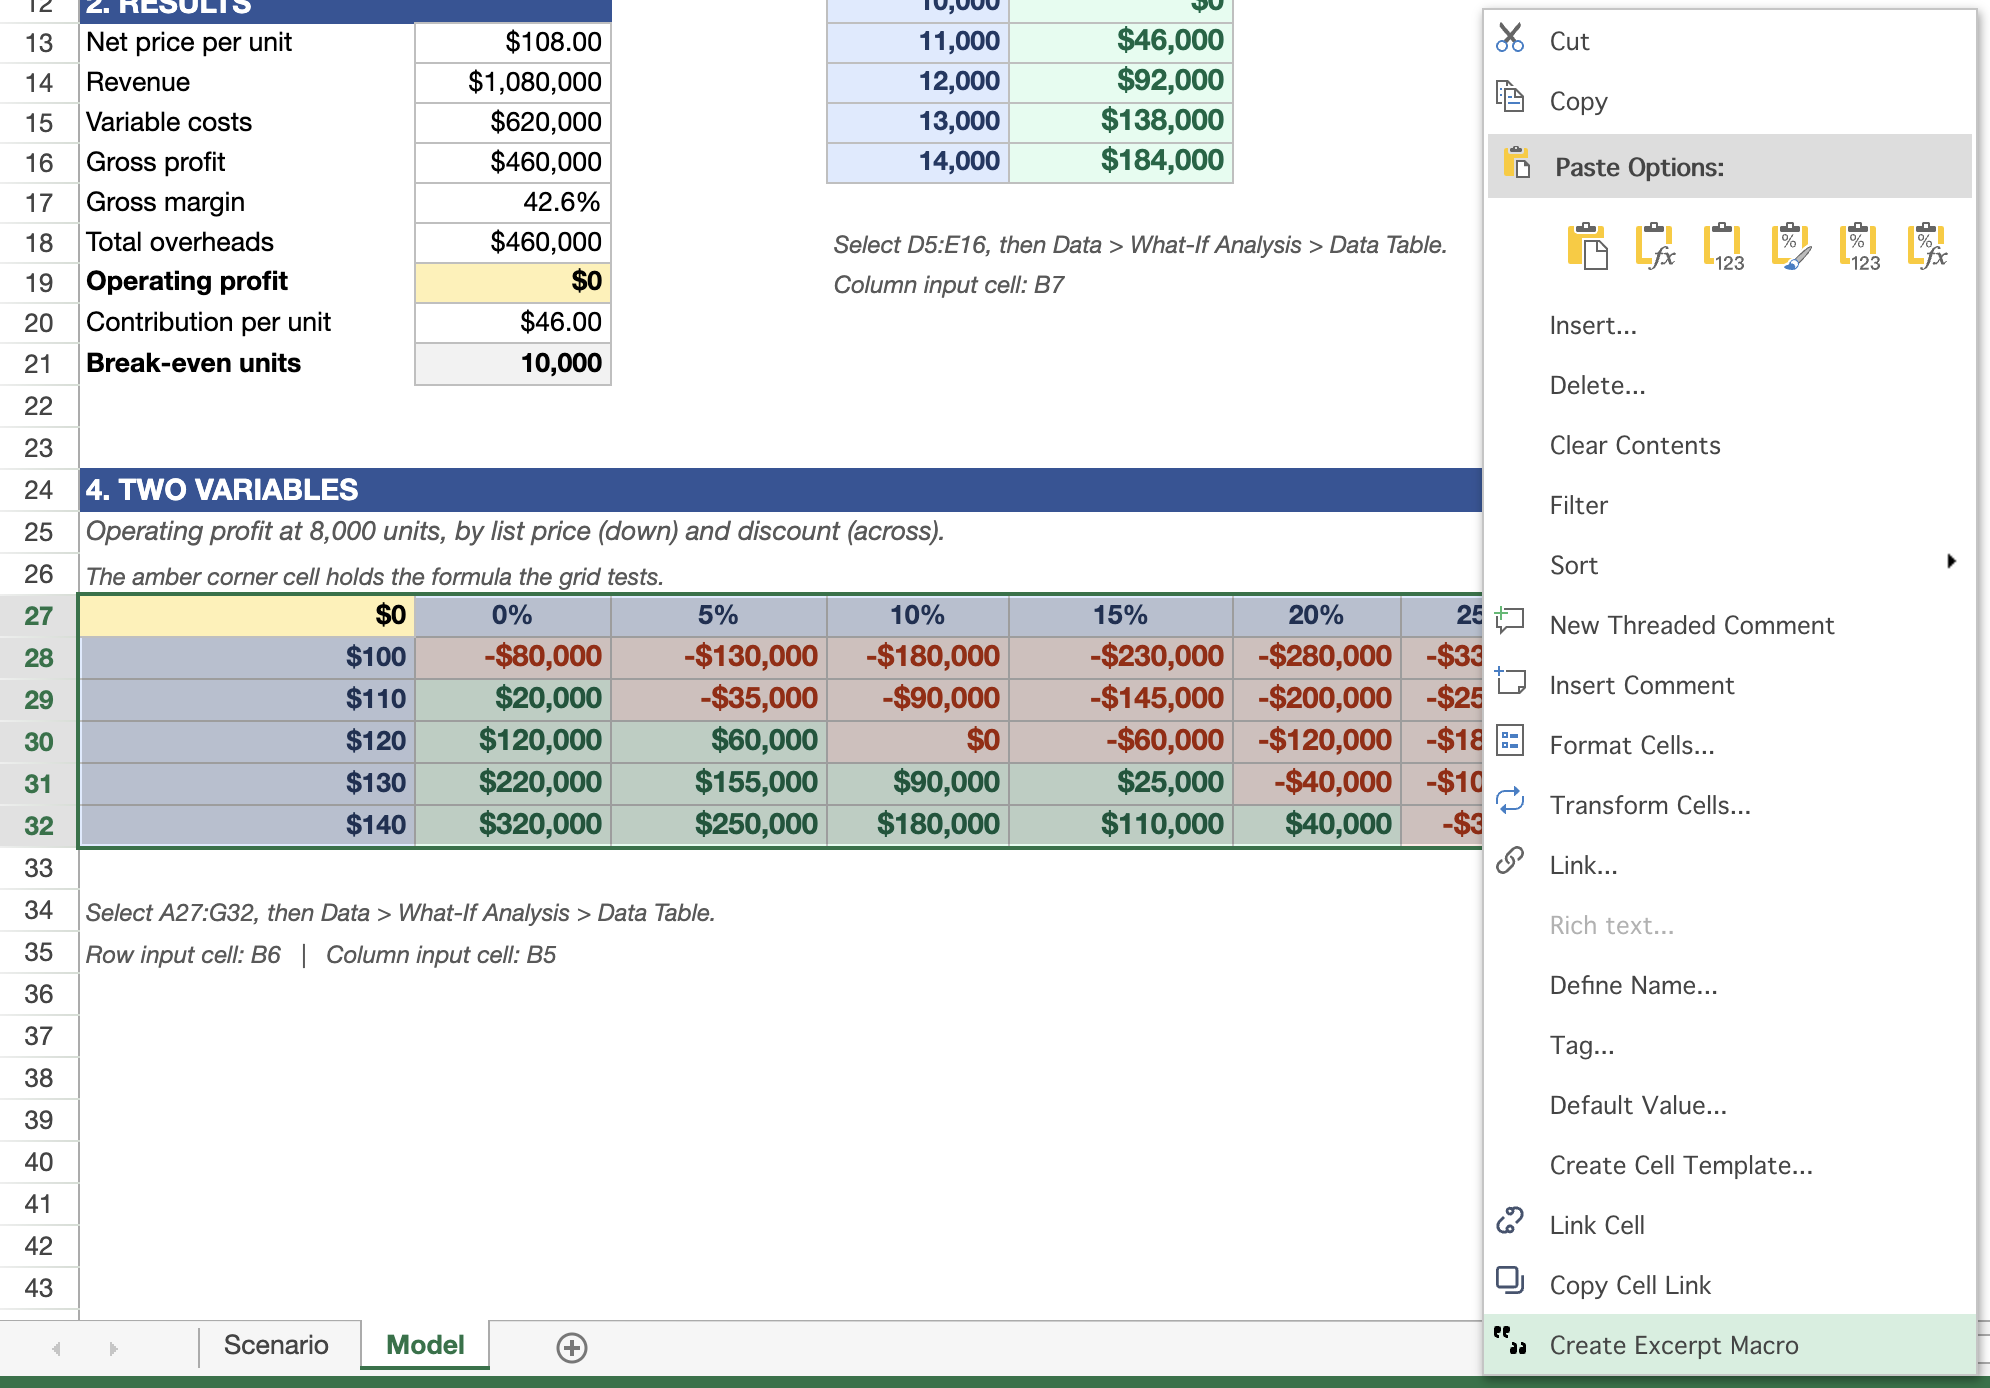
Right-click the table range, chart, or single cell that contains the result you want to share, then create the relevant excerpt. Stakeholders see only the selected output, while you continue refining the original What-If Analysis in the background.