The Excerpt Chart macro allows you to embed a chart from an Excel-like Table for Confluence (ETC) directly onto a Confluence page — as a clean, focused visual. Instead of embedding the full spreadsheet or table, this macro pulls just the chart, helping you showcase key insights exactly where stakeholders need to see them.
This is perfect for dashboards, status pages, or executive summaries, where clarity and impact are essential.
✨ Key Benefits
-
Visual Communication: Surface trends and key metrics in a compact, digestible visual form.
-
Contextual Display: Place a chart exactly where stakeholders need to see it — without extra gridlines, sheet tabs, or scrollbars.
-
Automatic Syncing: The chart allows for auto-updates when the data in the source ETC table changes, so you always show the latest numbers.
How to create
1. Insert the Macro
-
In Confluence page edit mode, type
/excerpt chart. -
Select the Excerpt Chart macro from the list.
2. Configure the Macro
-
A configuration panel will open.
-
Choose the source page containing the Excel-like Table.
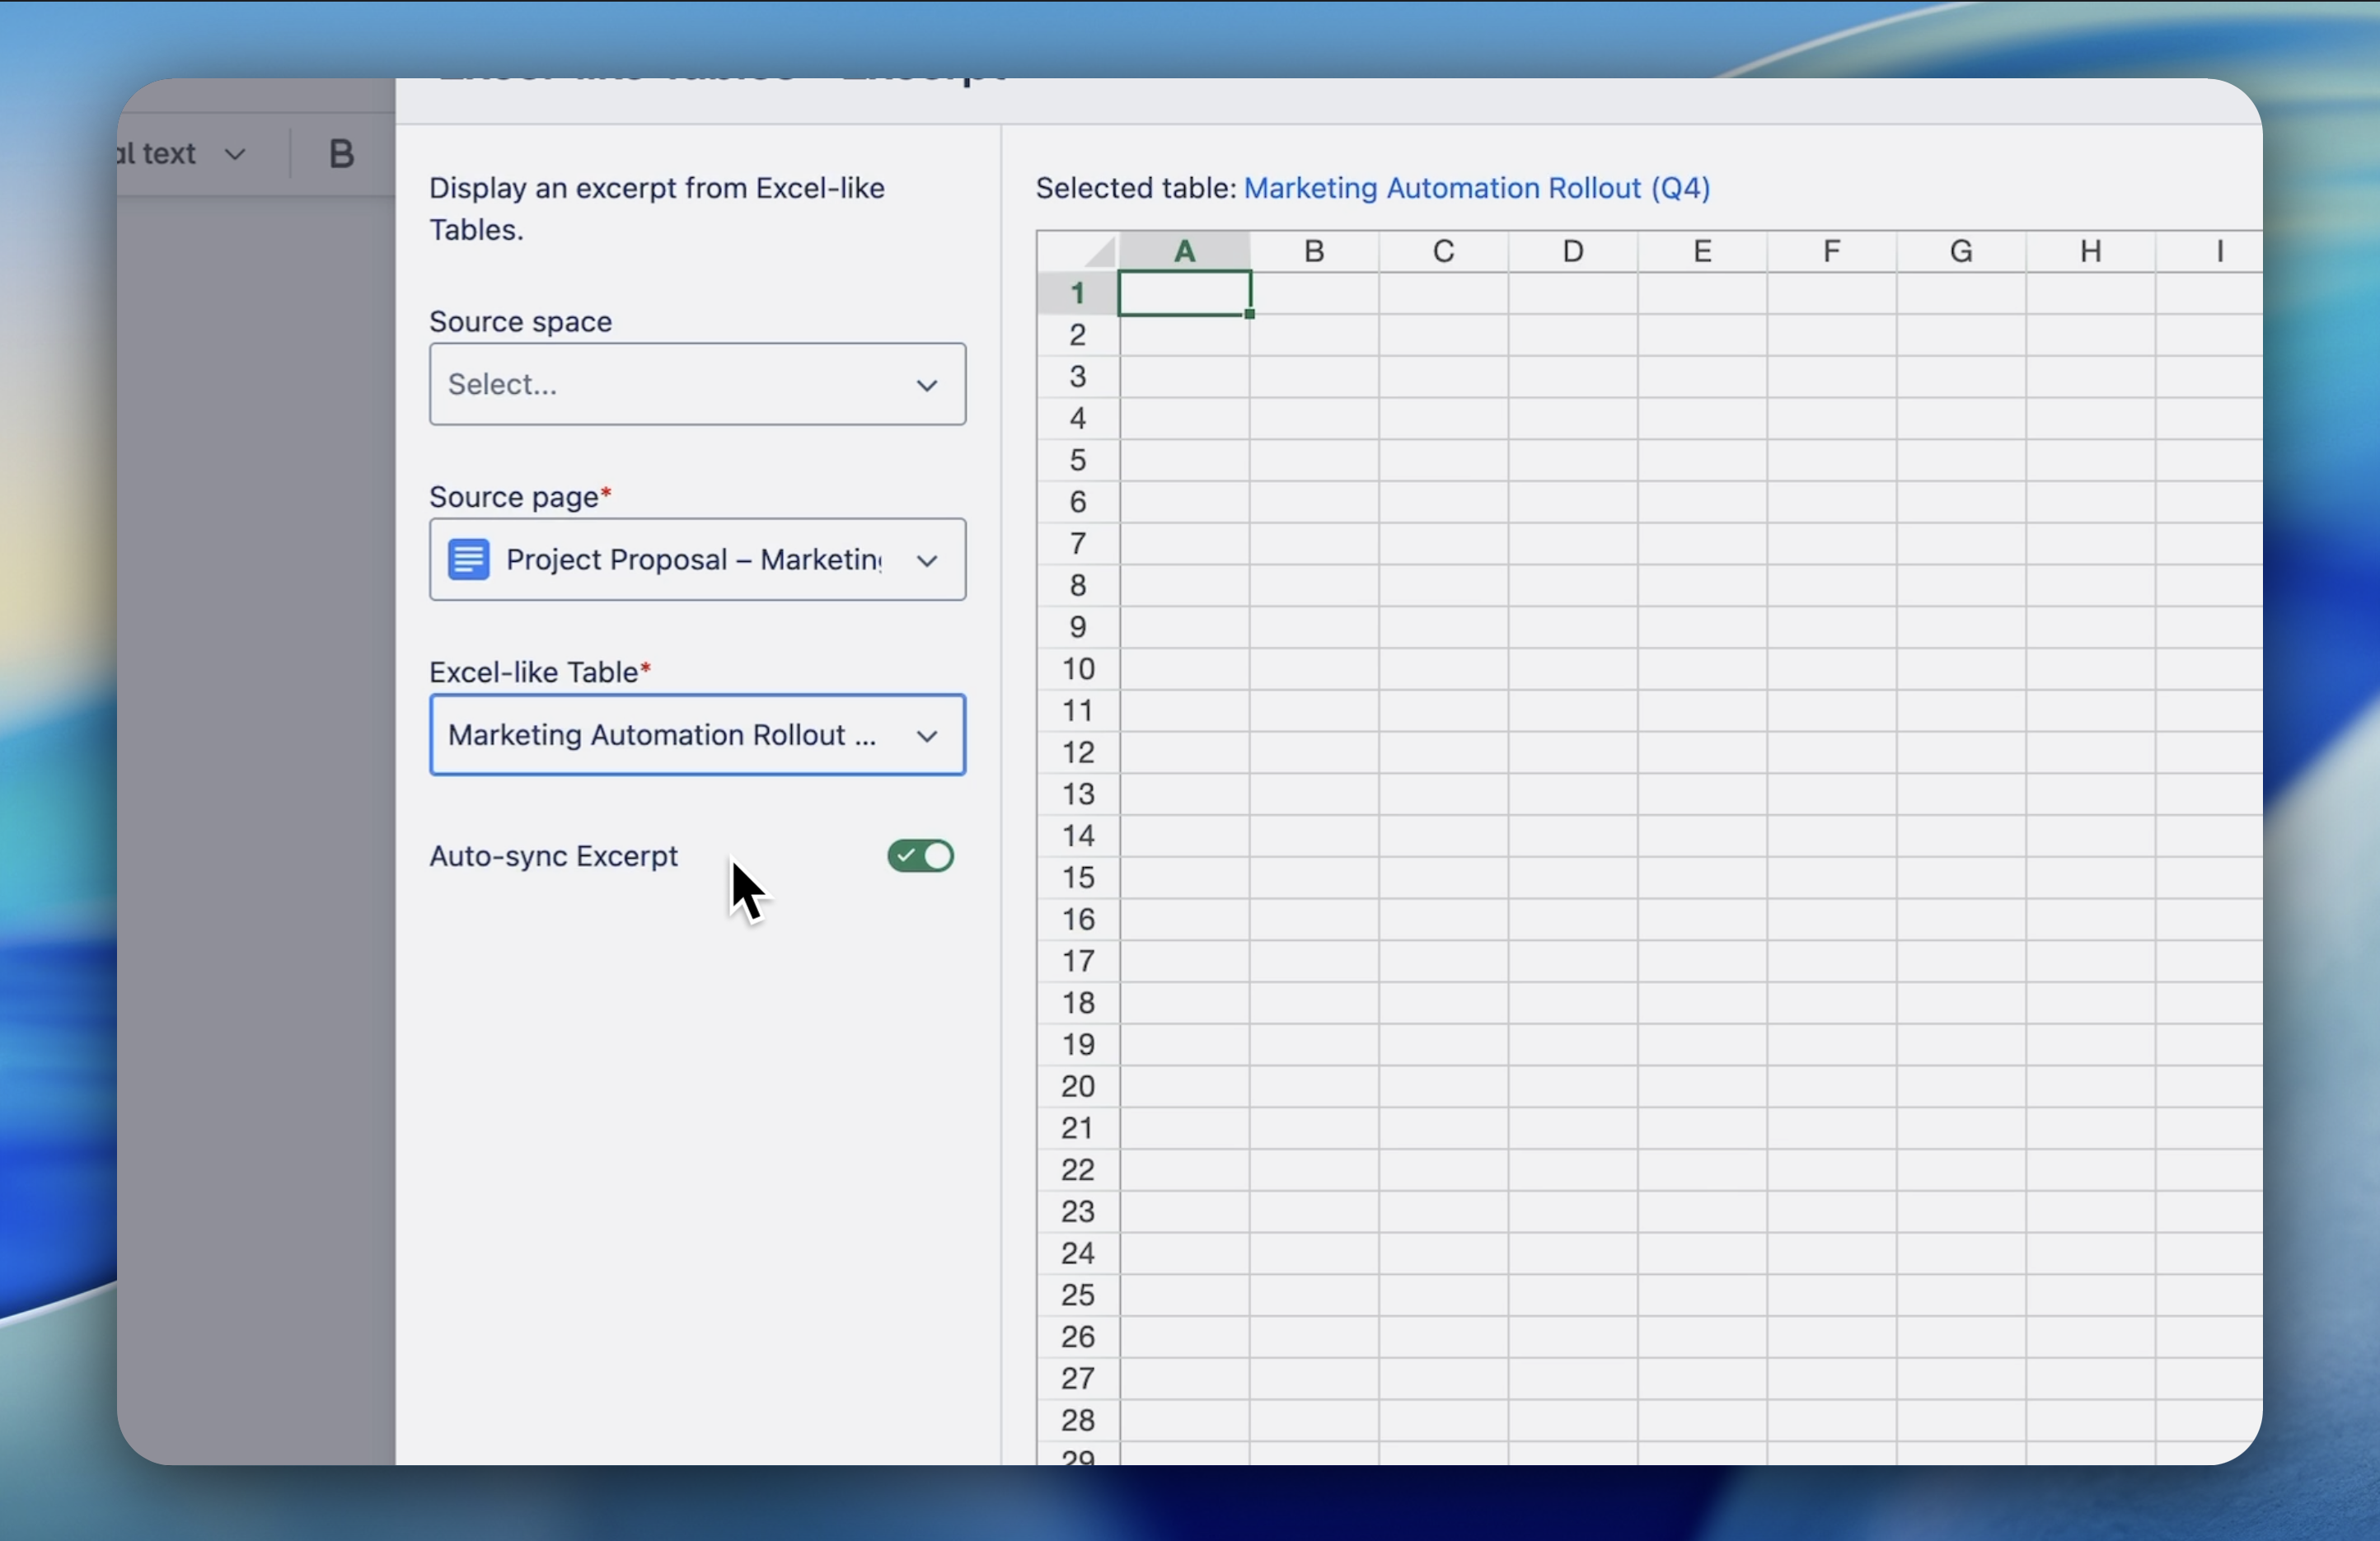
-
Select the target ETC sheet and the specific chart you want to excerpt.
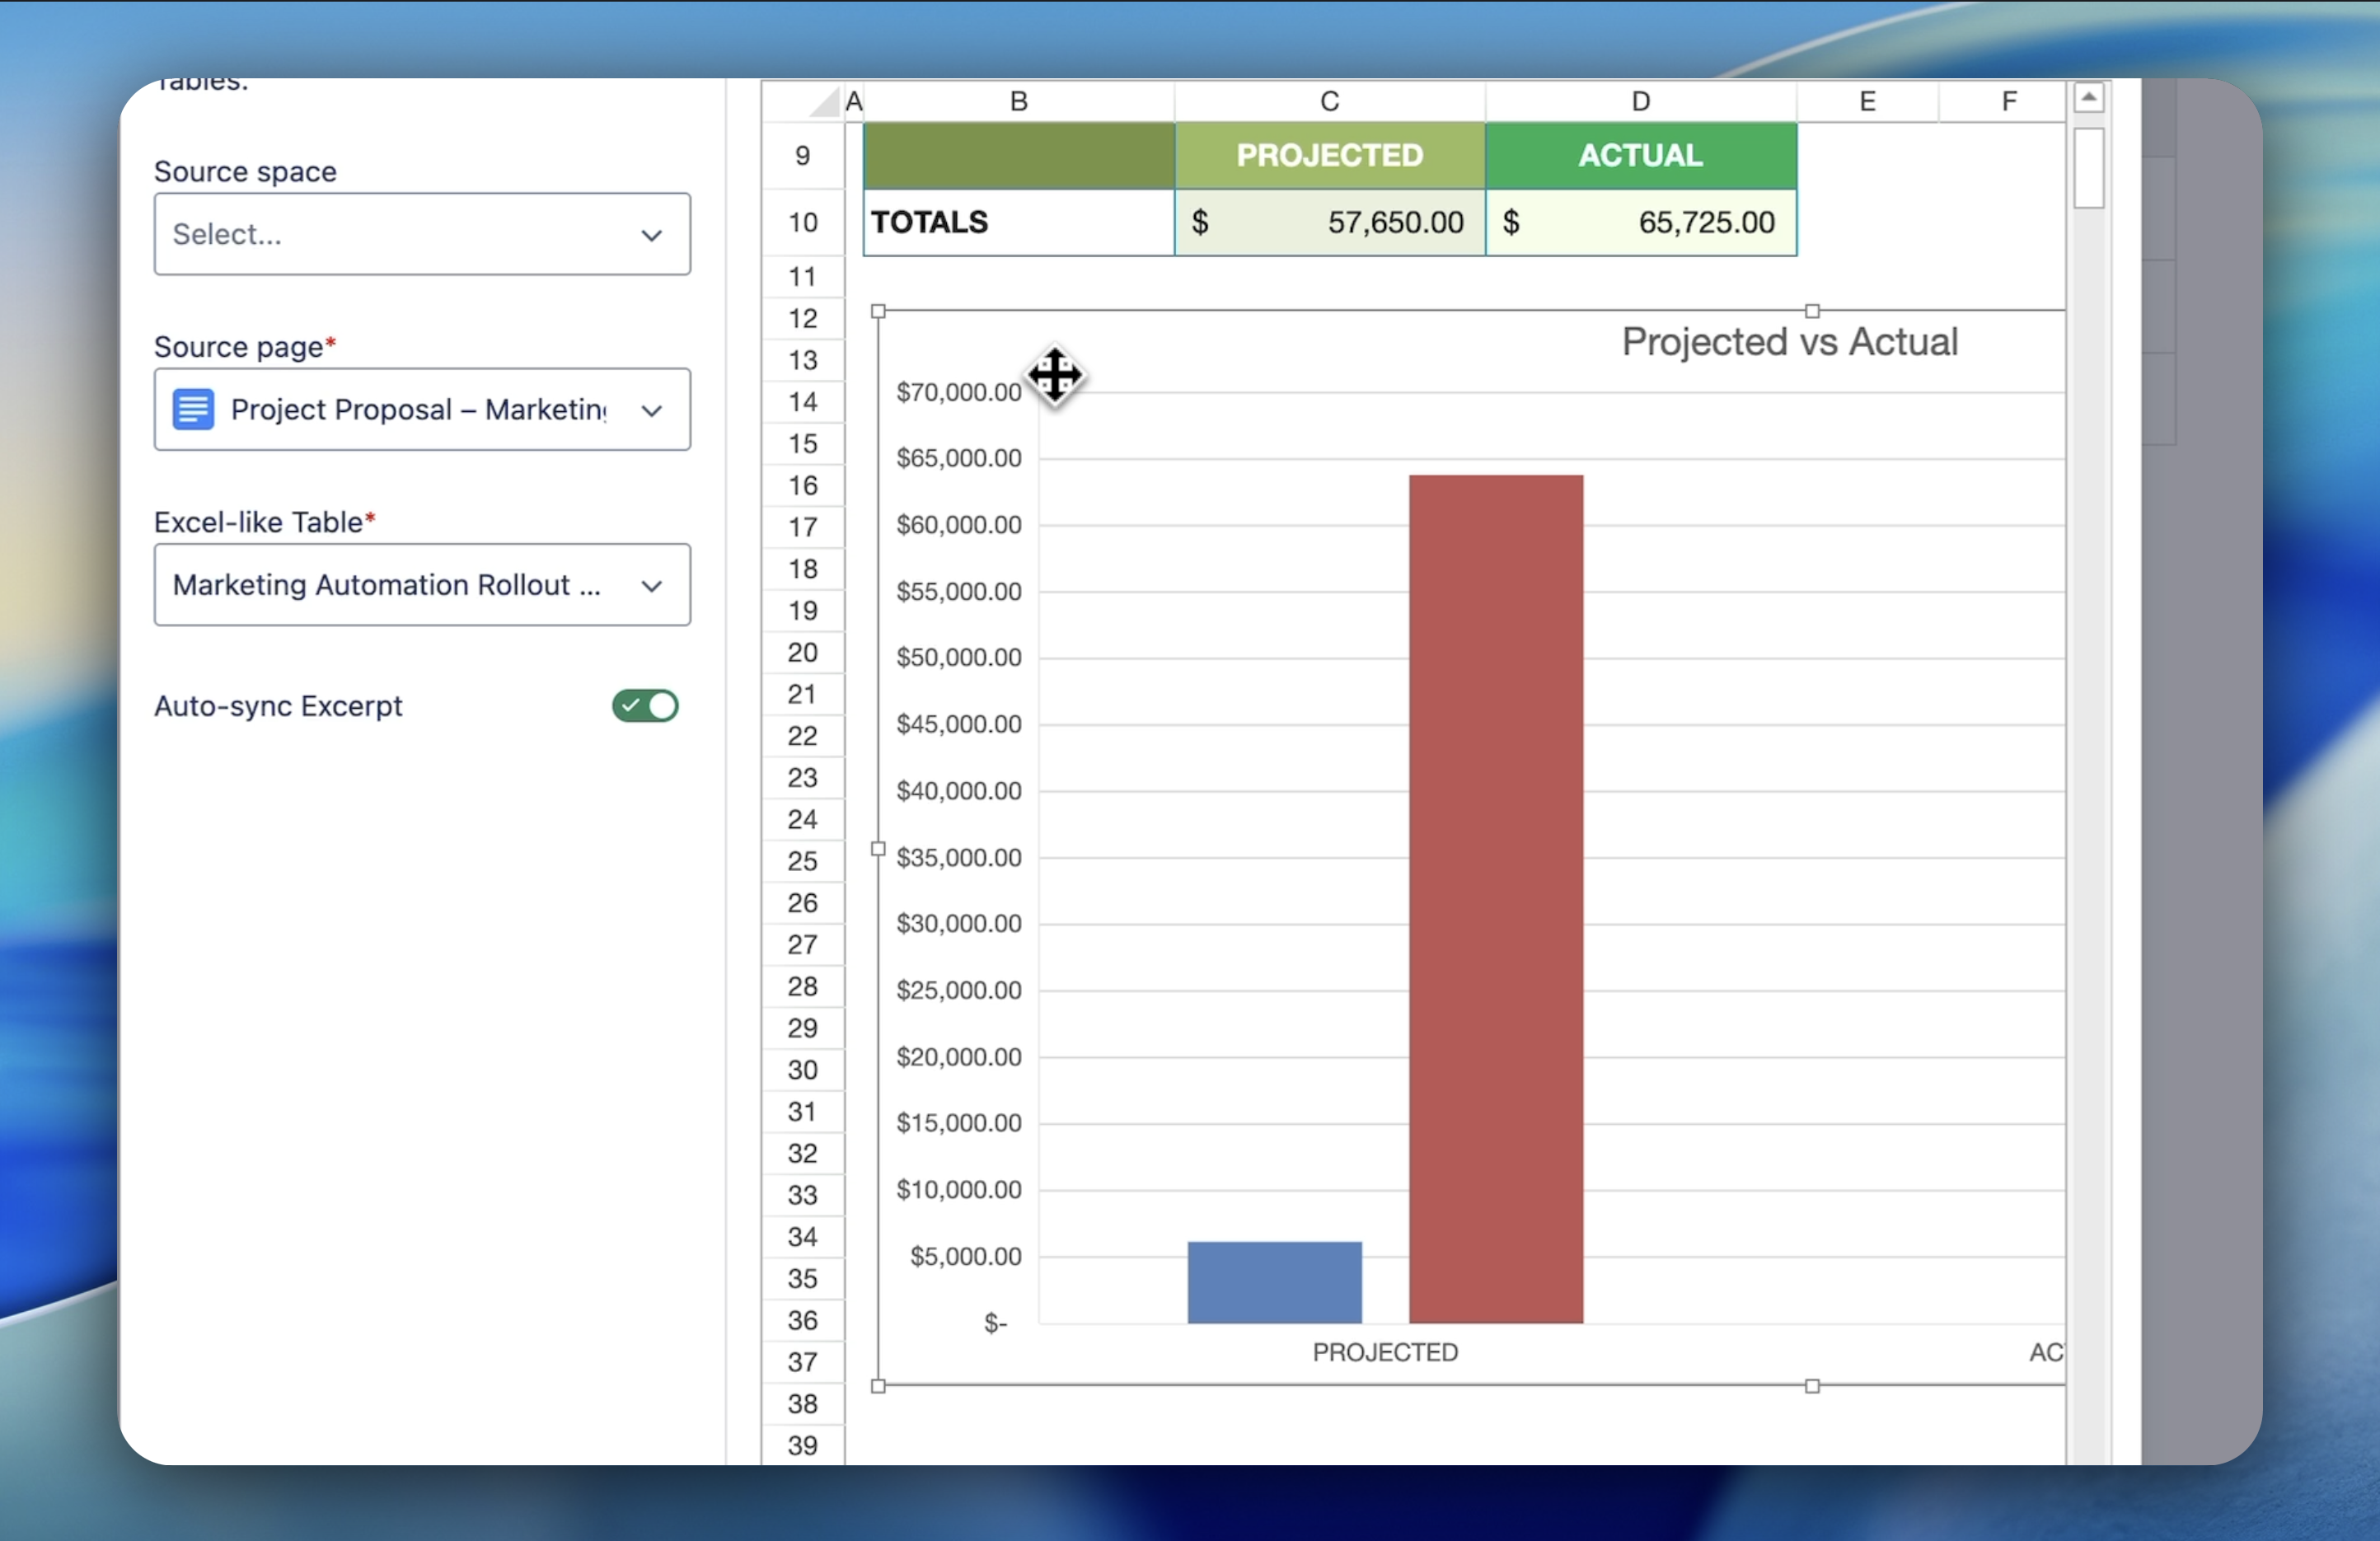
-
Click the Excerpt button to confirm your selection.
-
Toggle the Auto Sync option to ensure the excerpted chart automatically updates when the source table changes.
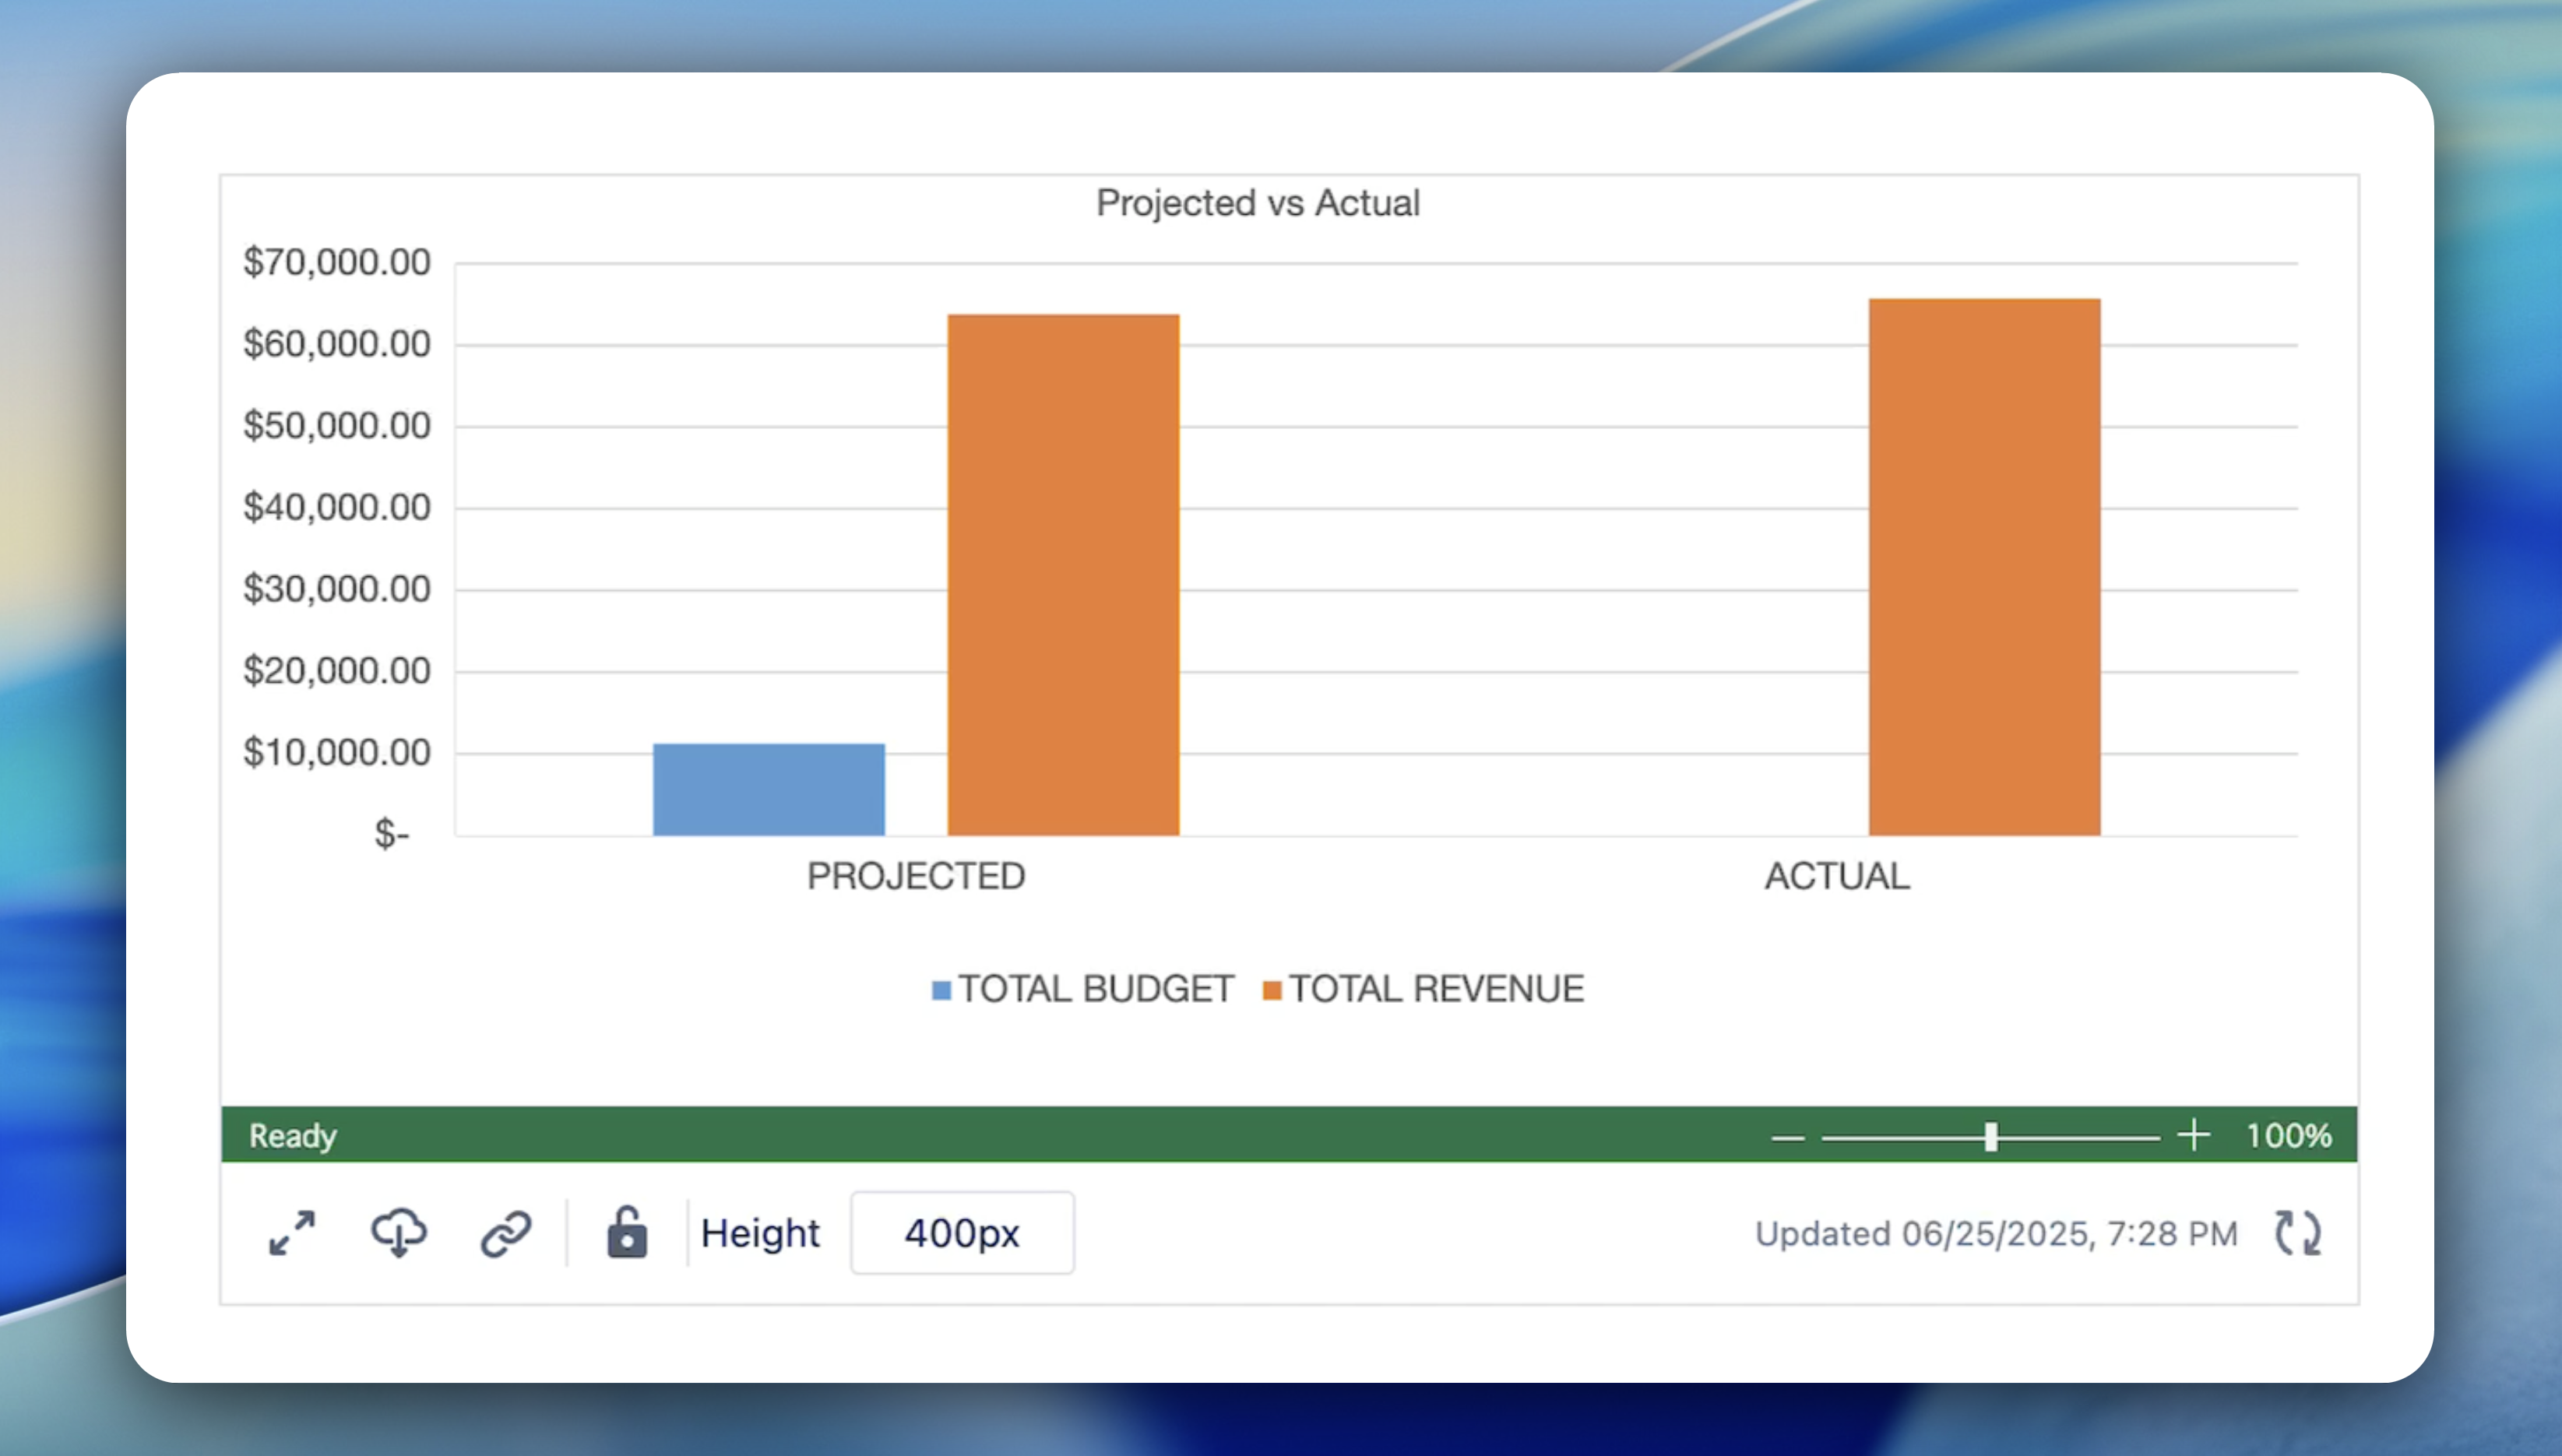
3. Finalize and Display
-
The selected chart will now be displayed on your Confluence page.
Use Case Examples
|
Stakeholder Group |
Use Case |
Description |
|---|---|---|
|
Executives |
KPI Dashboards |
Display visual charts of revenue, churn, or customer growth. |
|
Marketing |
Campaign Analytics |
Show performance charts from tracking sheets. |
|
Product Teams |
Release Metrics |
Embed burn-down or velocity charts into project pages. |
Known Limitation
🎨 Chart Styling May Differ from Source
While the Excerpt Chart macro faithfully reproduces the core structure and data of your chart, there are some important styling limitations to be aware of:
-
Excel-like themes (such as chart color palettes, fonts, and backgrounds) are not fully preserved in the excerpt view.
-
Some custom formatting, including axis label rotation, gridline visibility, and legend positioning, may render differently or revert to default styles.
-
Charts composed of shapes will not render.
To modify a macro:
-
Hover over the macro you wish to edit.
-
Click on the Edit button that appears.
This will open the macro's settings, allowing you to make the necessary changes.