
Actions you can do from the operation bar:
Search Bar
Input a keyword then press Enter (Return for Mac) on your keyboard.
Hierarchy View
Users can view their issues’ (Epic - Story - Subtask) hierarchy in Hierarchy View mode.
In this mode, users can collapse and expand the hierarchy.
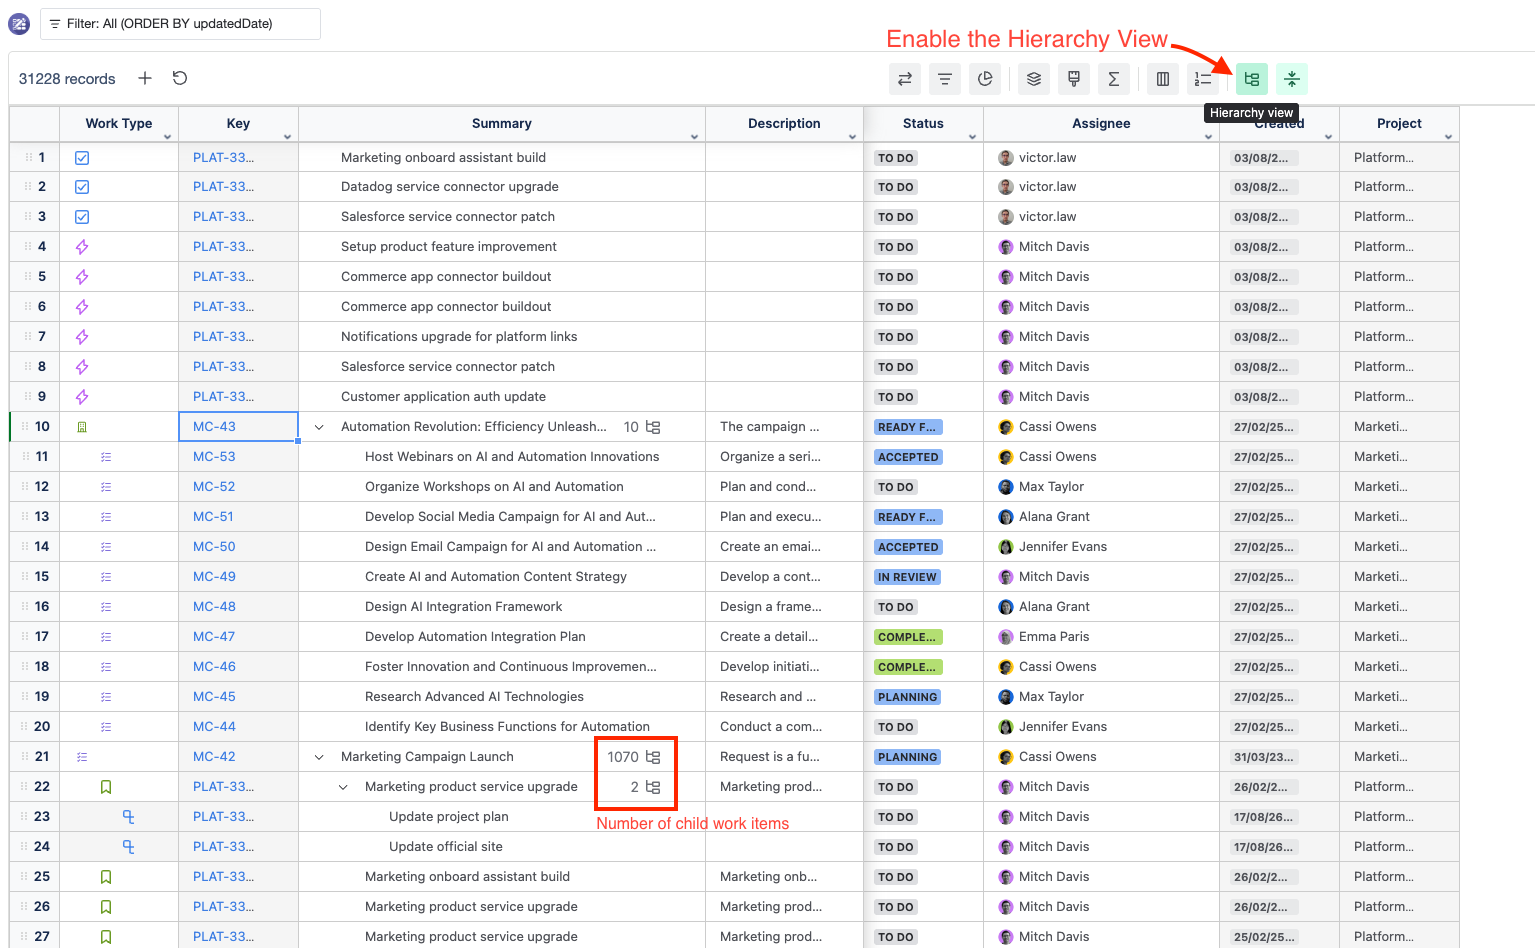
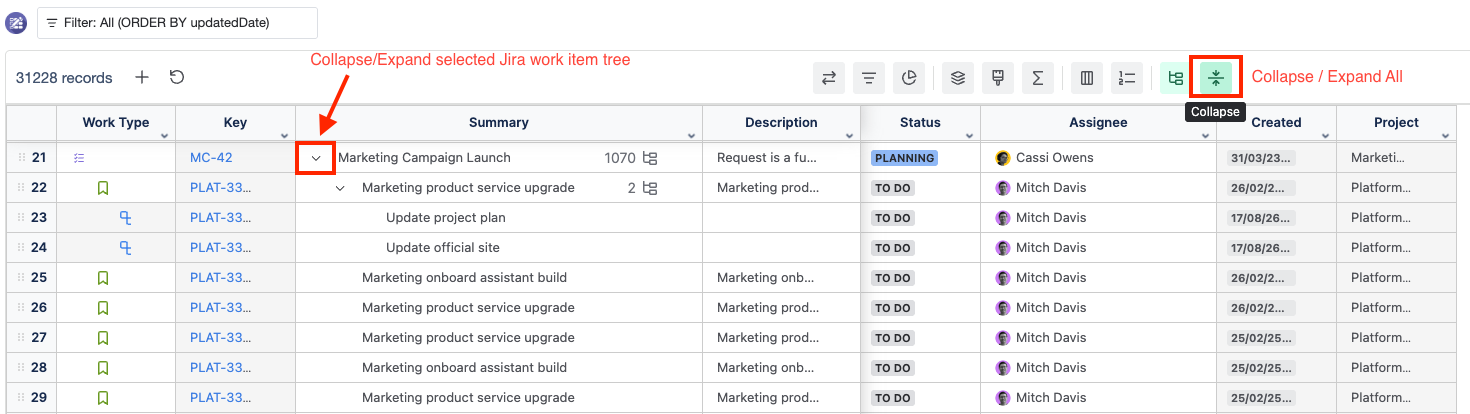
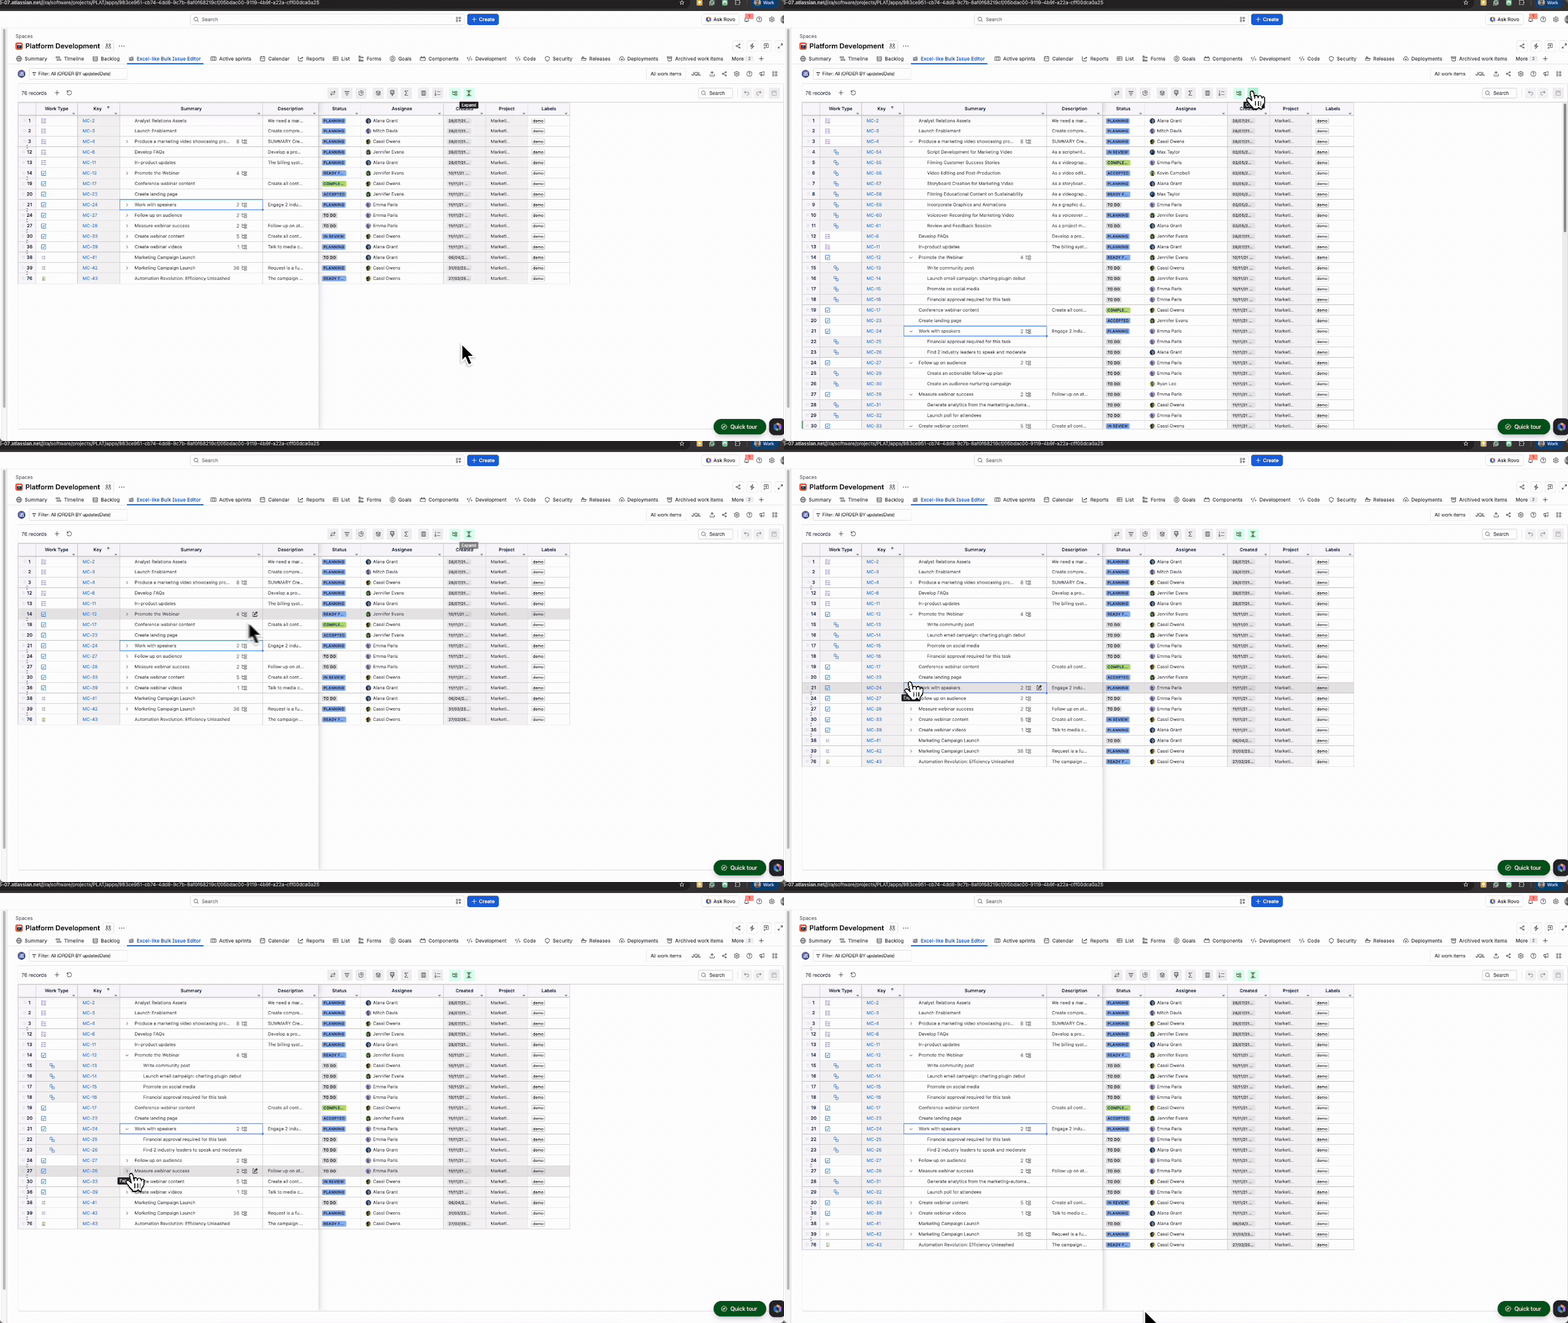
Hierarchy view mode requires all issues to build a hierarchy tree, so it automatically switches to "All" mode in hierarchy mode.
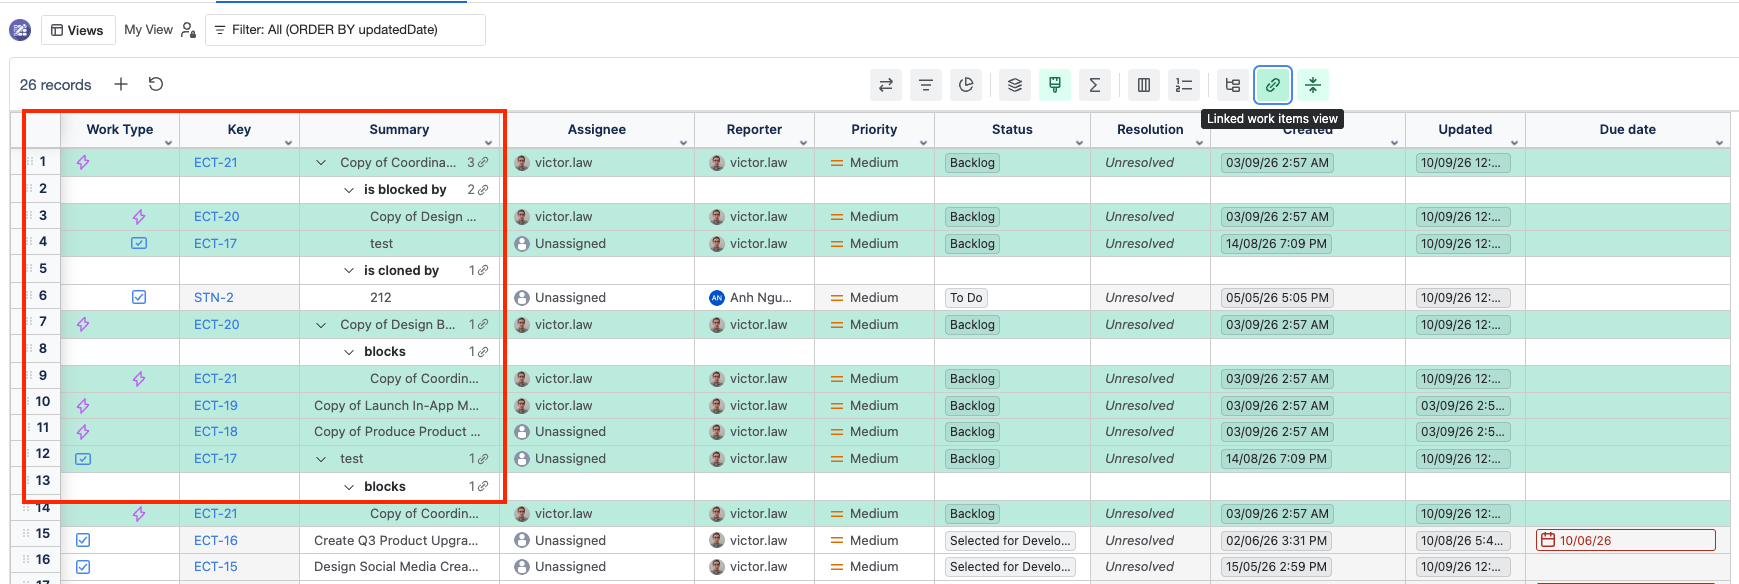
Linked Work Items View
View dependency chains and issue relationships (Blocks, Relates To, etc.) directly in the spreadsheet without opening individual Jira tickets.
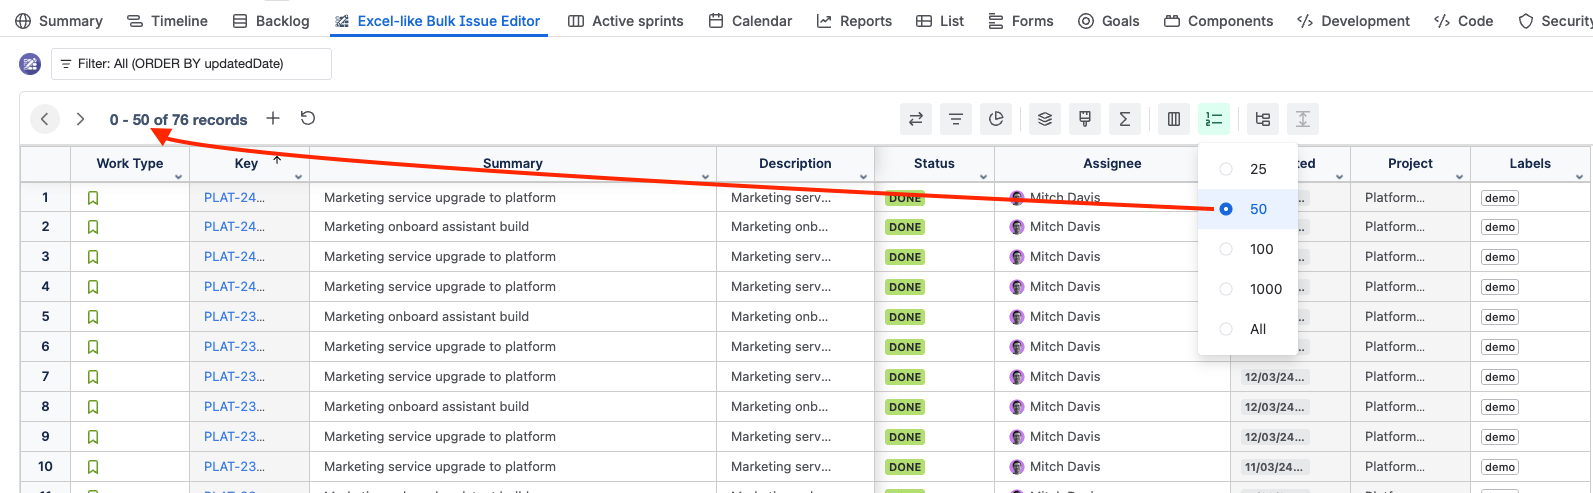
Grid view
You can change the number of issues per page as below
Column Configuration
From here, you can:
-
Freeze or unfreeze columns
-
Hide or display columns
-
Rename columns
-
Create customized column configuration
Freeze/unfreeze or Hide/display columns
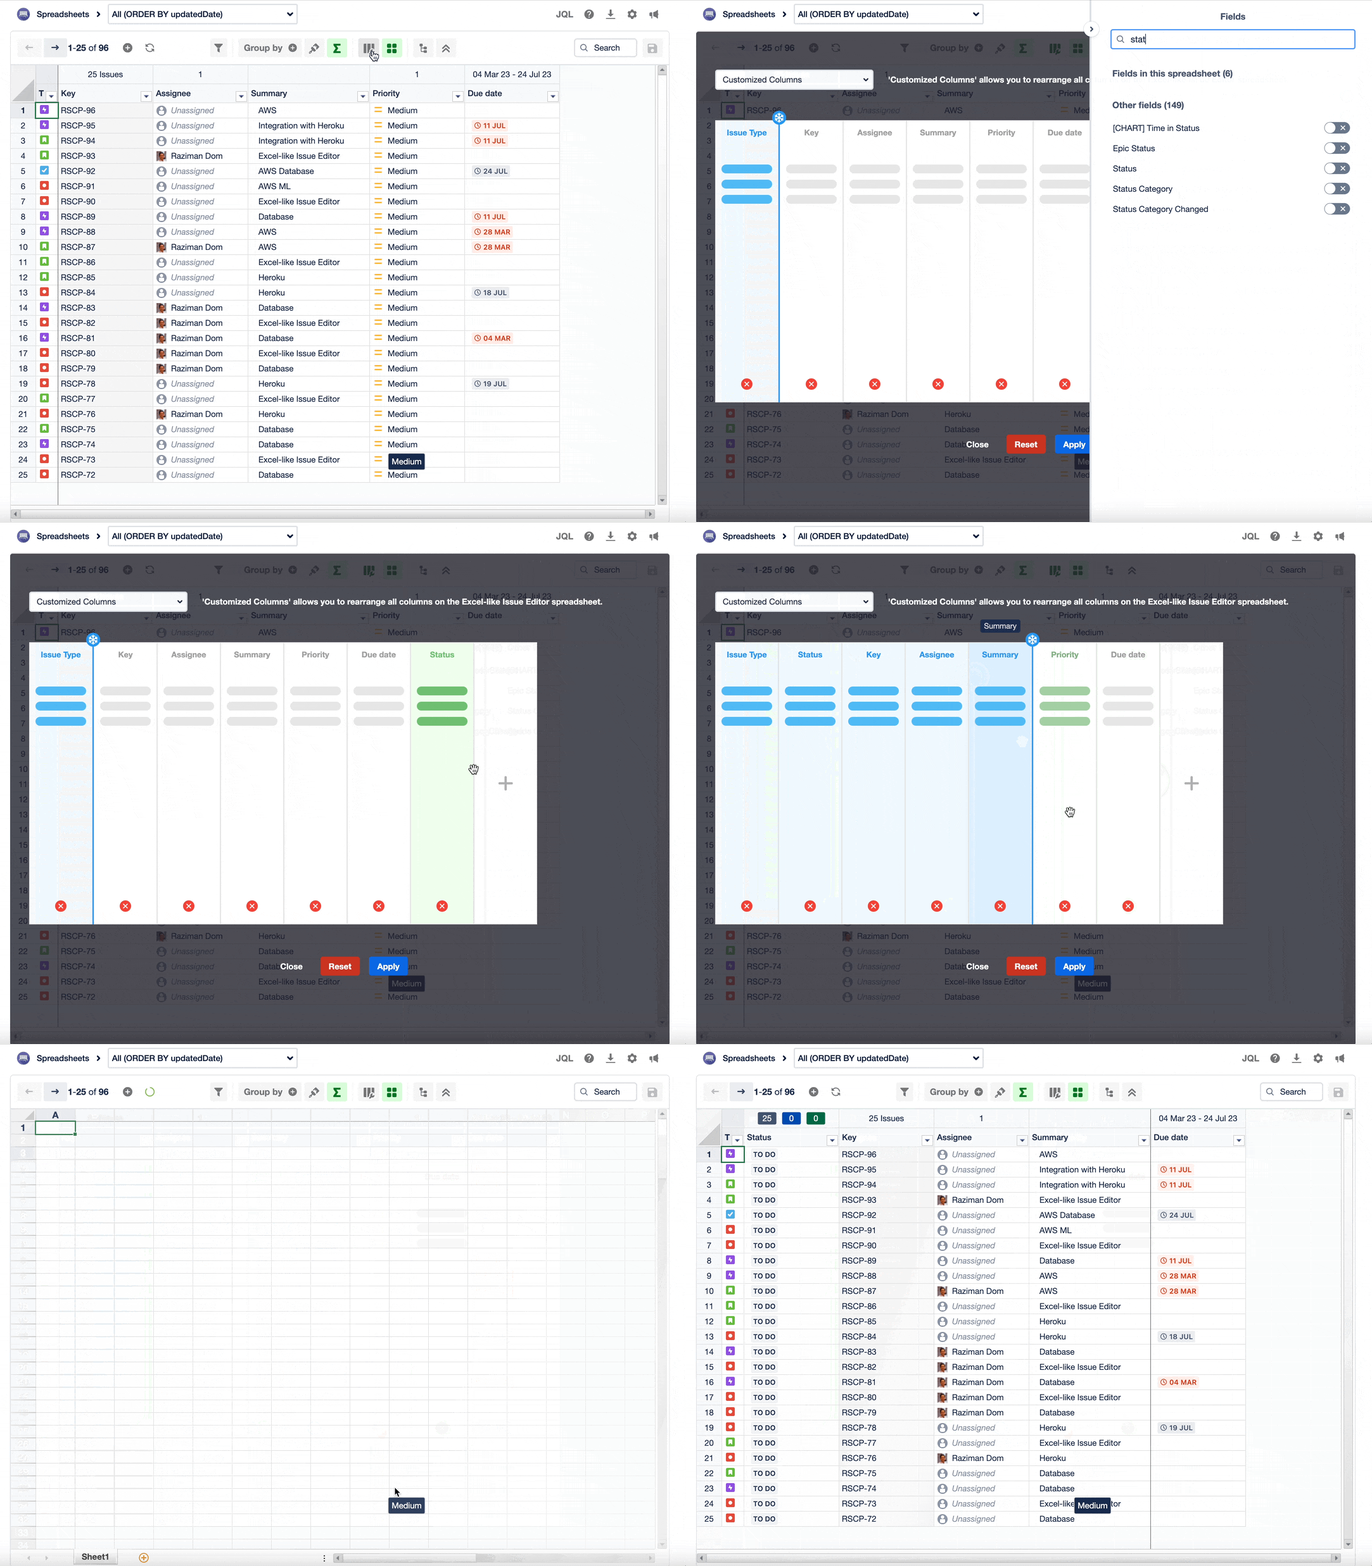
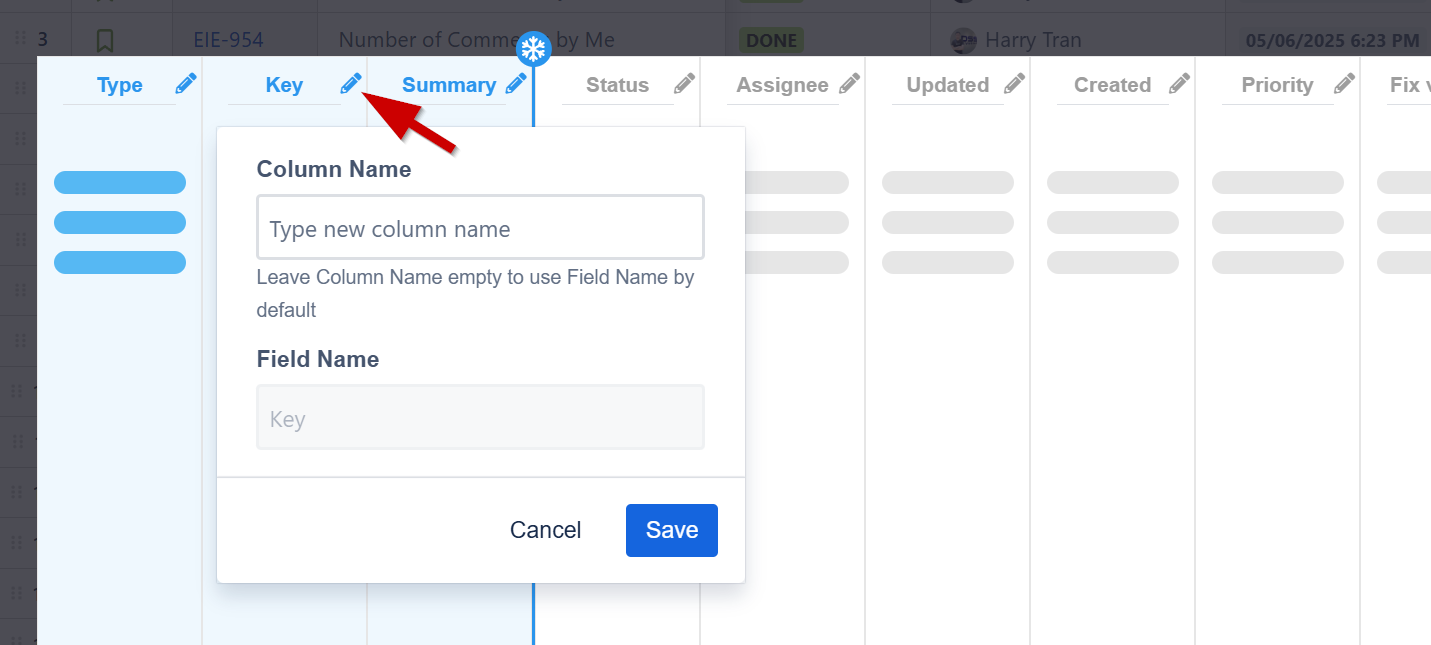
Rename Columns
If the default column name is too long, you can rename it as needed.
Create customized column configuration
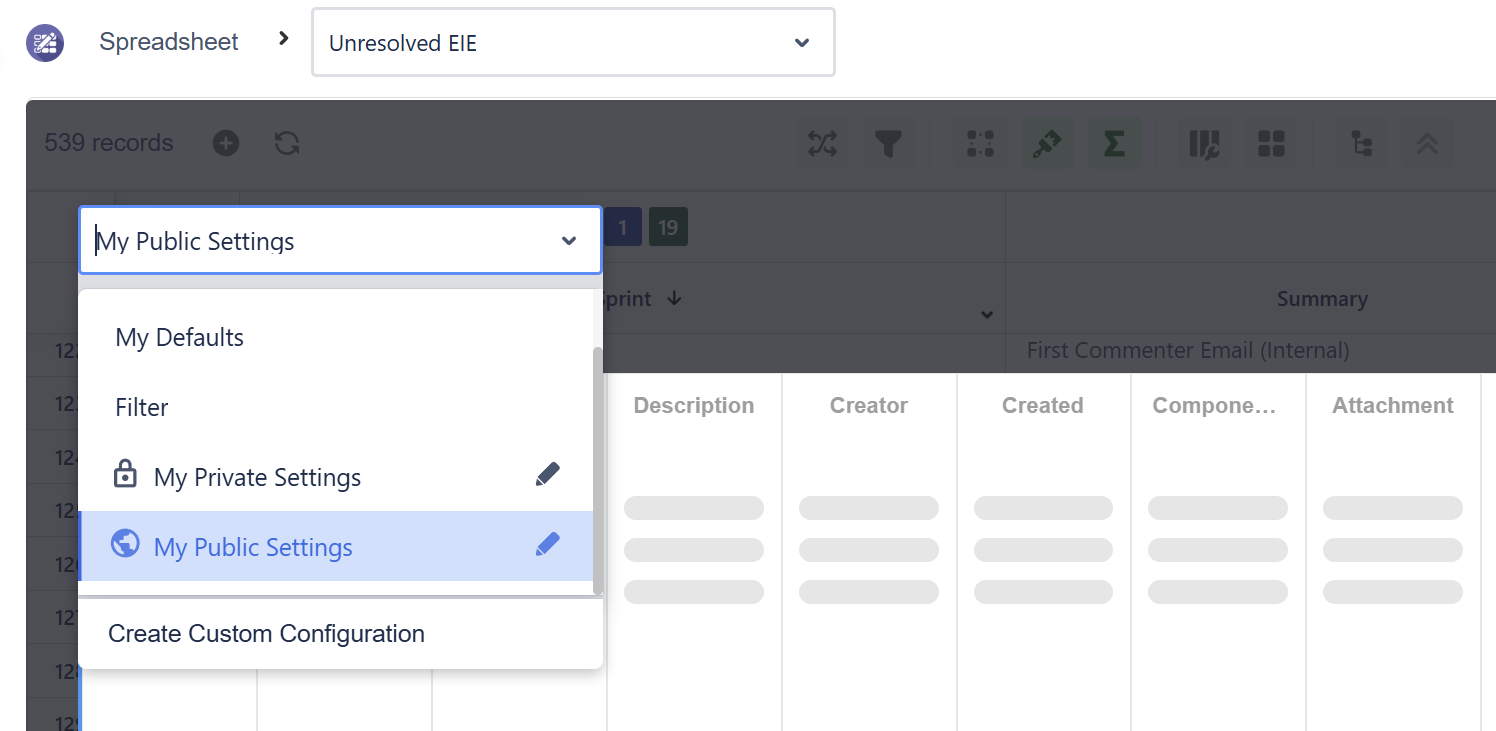
You can create multiple column configurations according to your requirements.
-
The lock icon means it is only available to you.
-
The globe icon means other users can use your setting.
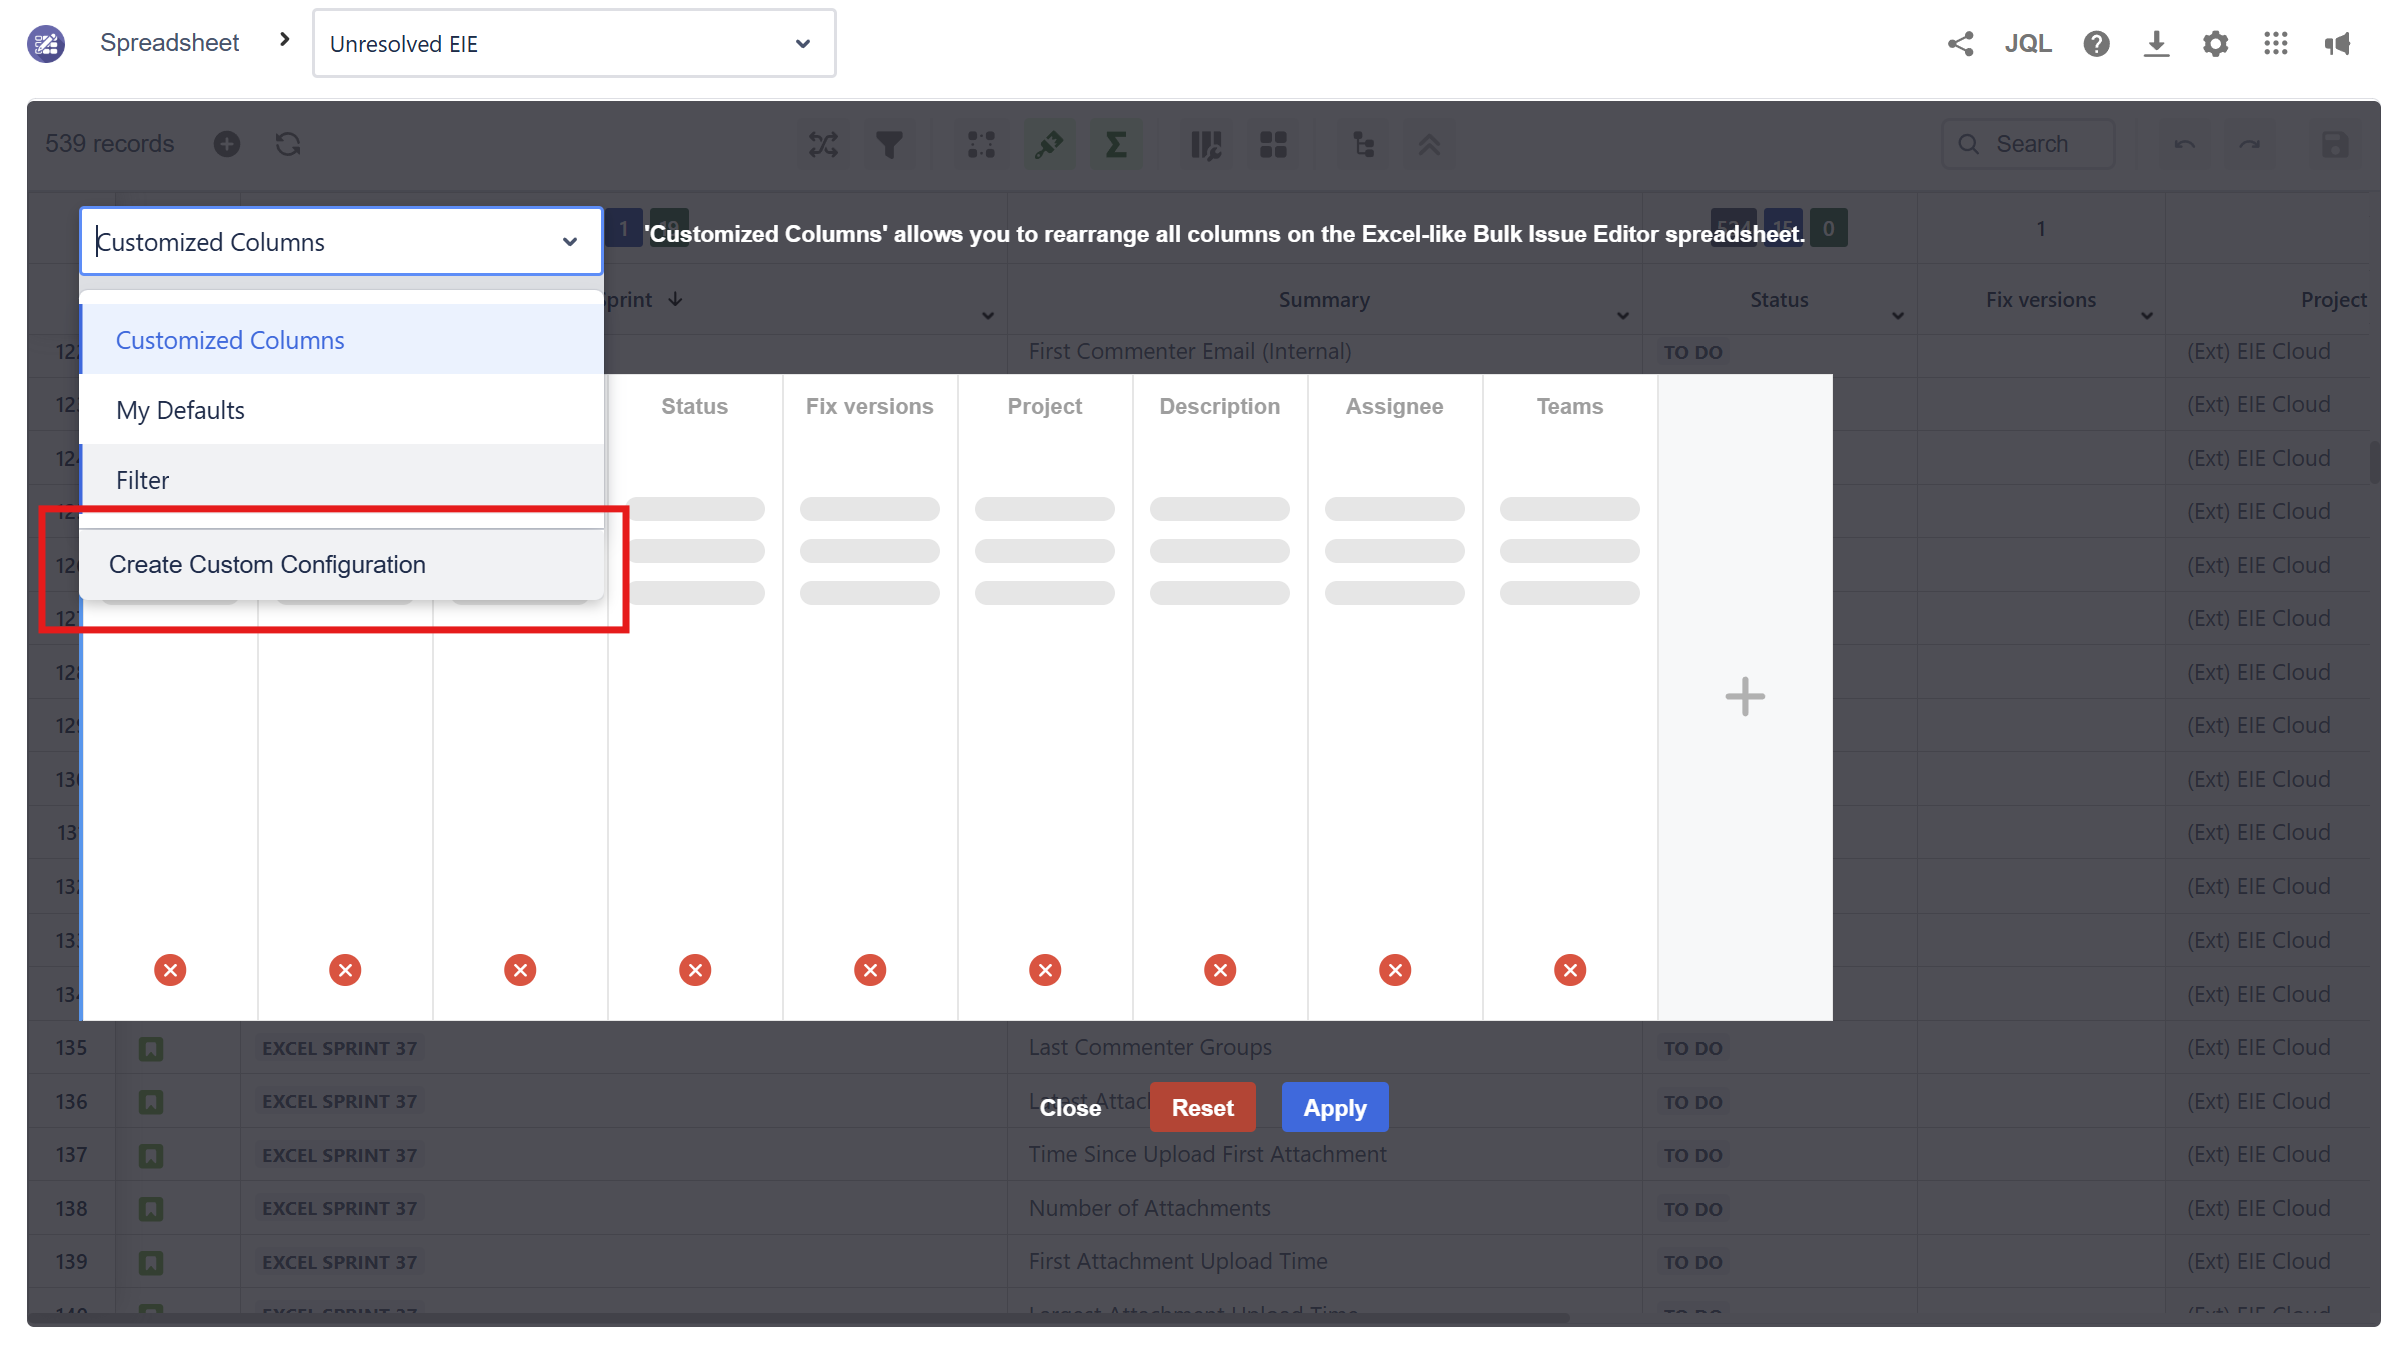
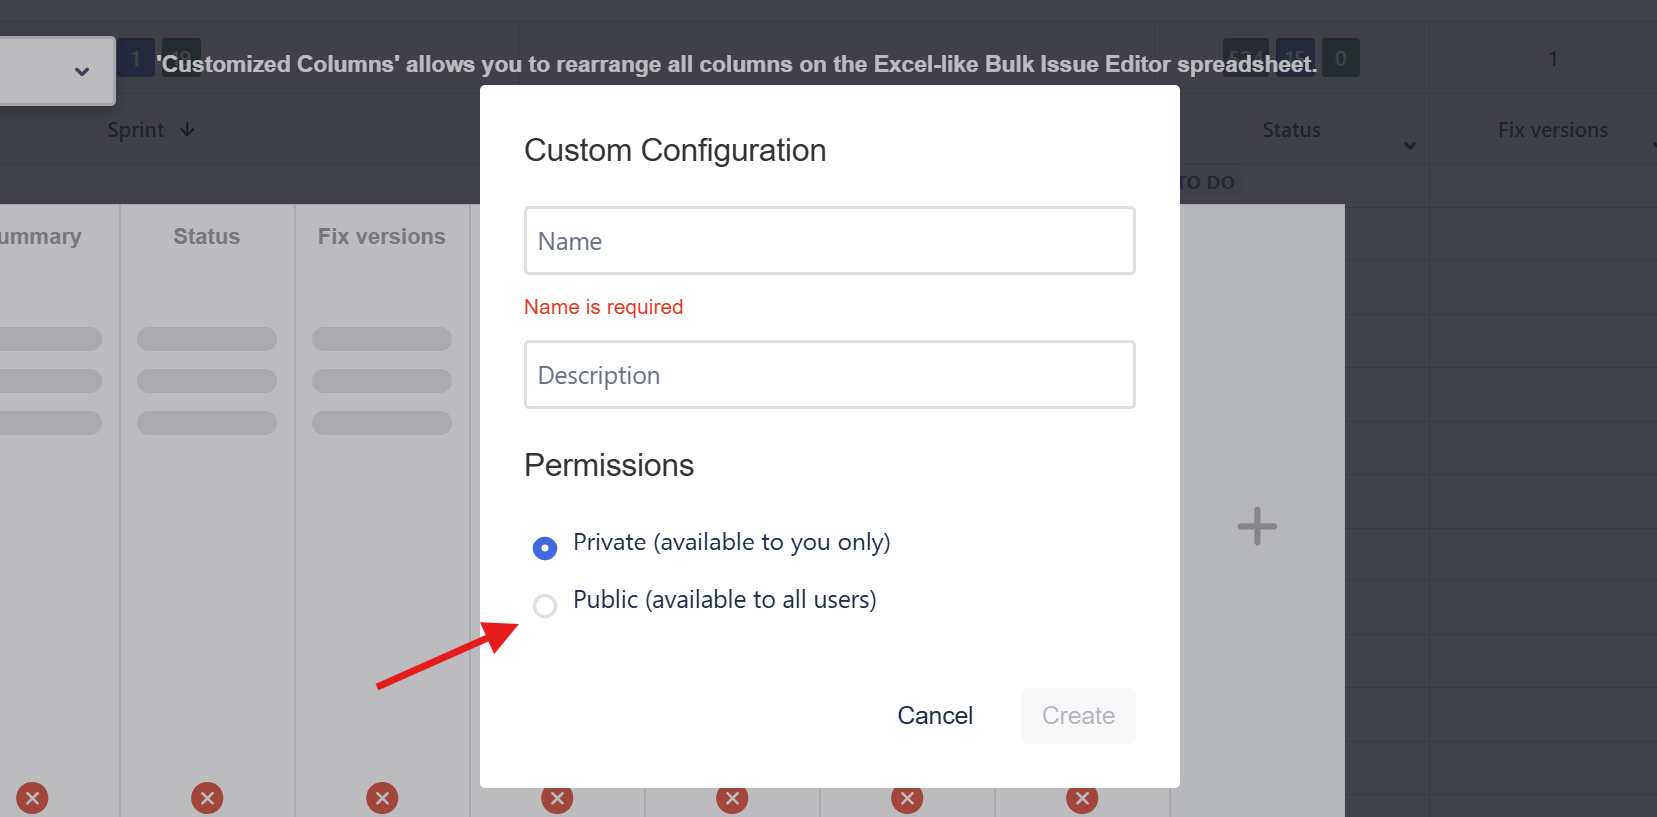
If you want to create a column configuration and share with other users, you can select the ‘Create Custom Configuration’ and select ‘Public’.
Sum-Up Row
This feature lets users get the sum or summary of their Jira field values. Users can open it by clicking the sum button on the operation bar.

Hovering over the sum-up row displays the total number of issues and the corresponding percentage.
Sum-up row's behavior
|
Field |
Sum up Action |
|---|---|
|
Number |
Sum |
|
Time Tracking Field |
Sum and support Time Tracking format |
|
Date, Time |
Show Min - Max 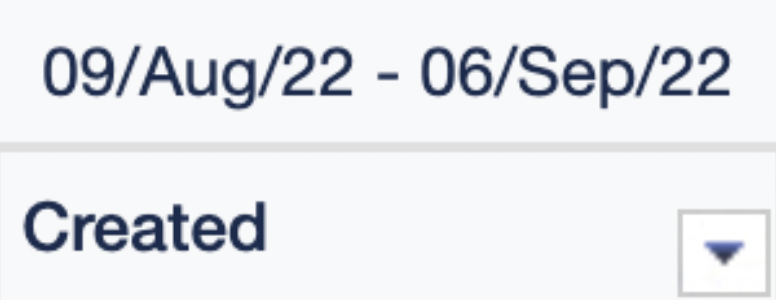
|
|
Selection Object
|
Count the unique values |
|
Checkbox |
Count the unique values |
|
Status |
Total status grouped by status category 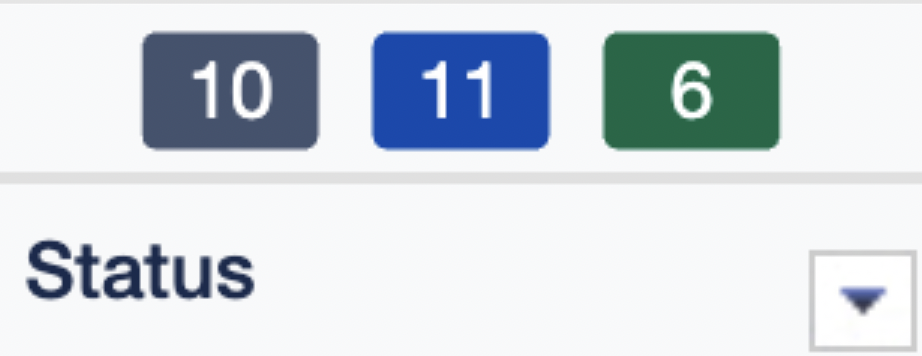
|
|
Resolution |
Percentage of resolved issues. Resolved refers to the resolution field with a value. 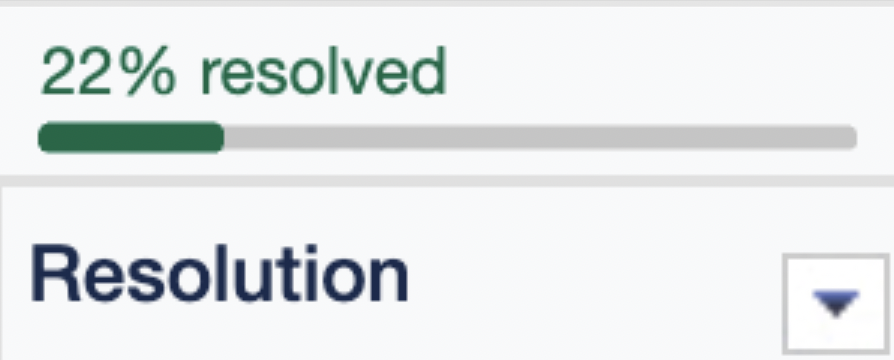
|
|
Sprint |
Total of sprints grouped by sprint status 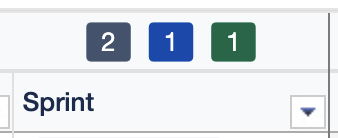
|
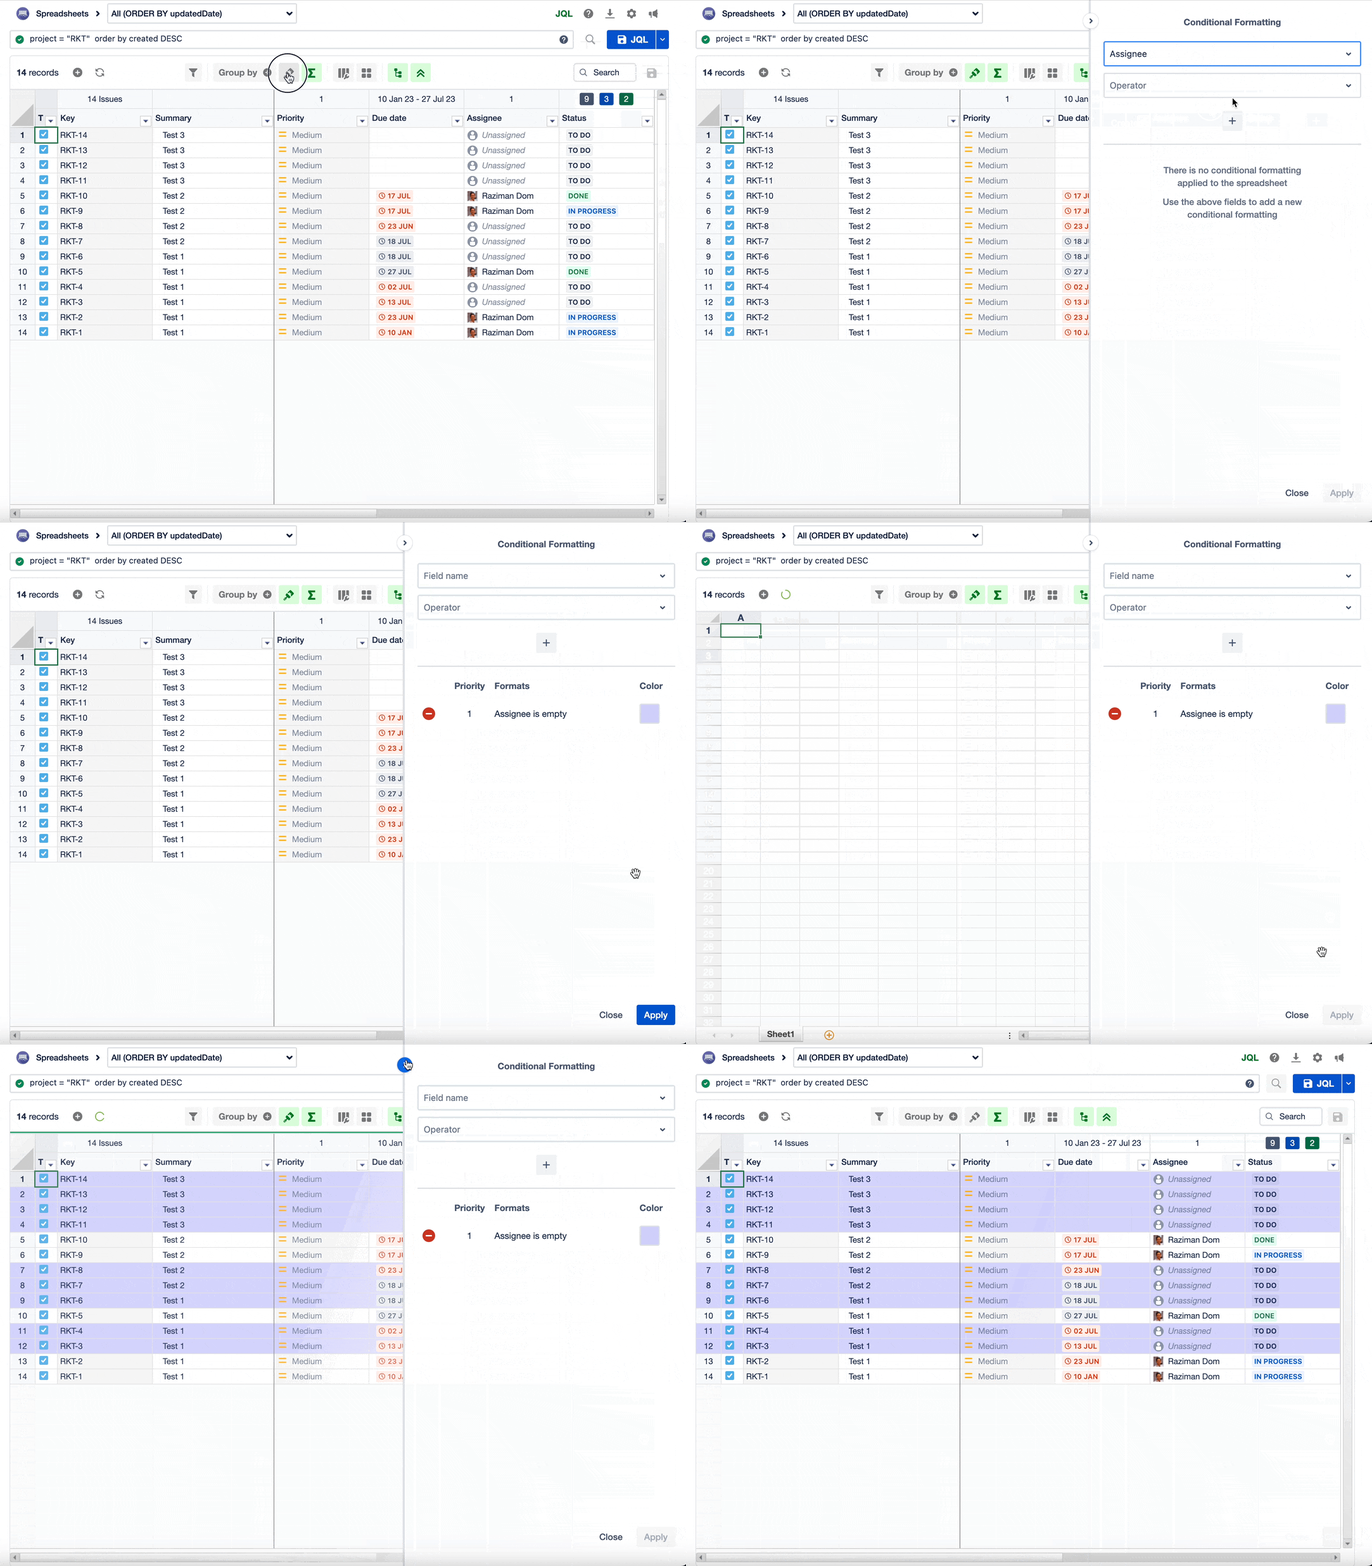
Conditional Formatting
Conditional formatting lets users set conditions to reformat cell colors in their spreadsheet. This feature improves visibility when users search for specific information.
|
Data type |
Support |
|---|---|
|
Text |
Supported |
|
Number |
Supported |
|
Date |
Supported |
|
Date time |
Not supported |
|
User |
Supported |
|
Label |
Supported |
|
Component |
Supported |
|
Status |
Supported |
|
Radio |
Supported |
|
Checkbox |
Supported |
|
Single select list |
Not supported |
|
Multiple select list |
Not supported |
|
URL |
Supported |
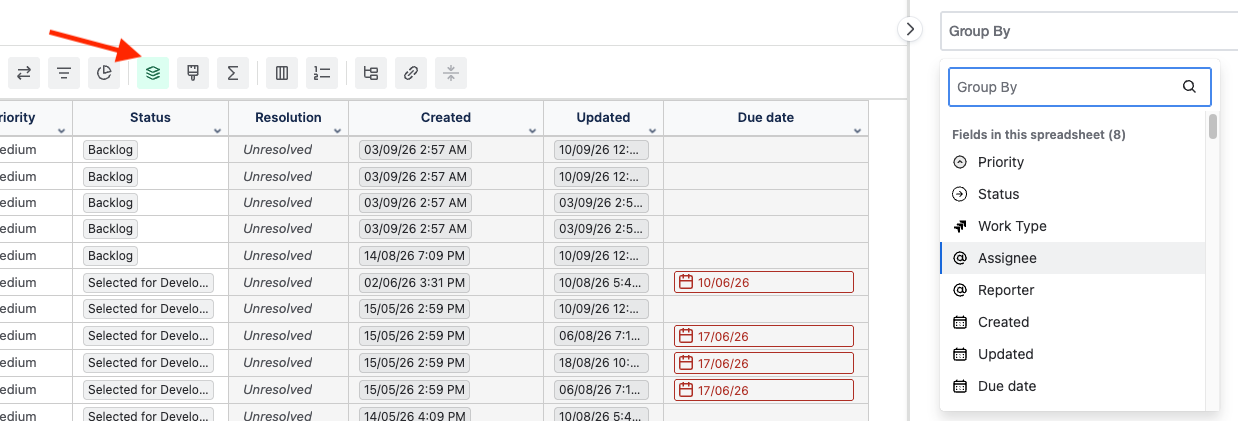
Group By
Group by groups spreadsheet rows by the selected field.
Smart Filter
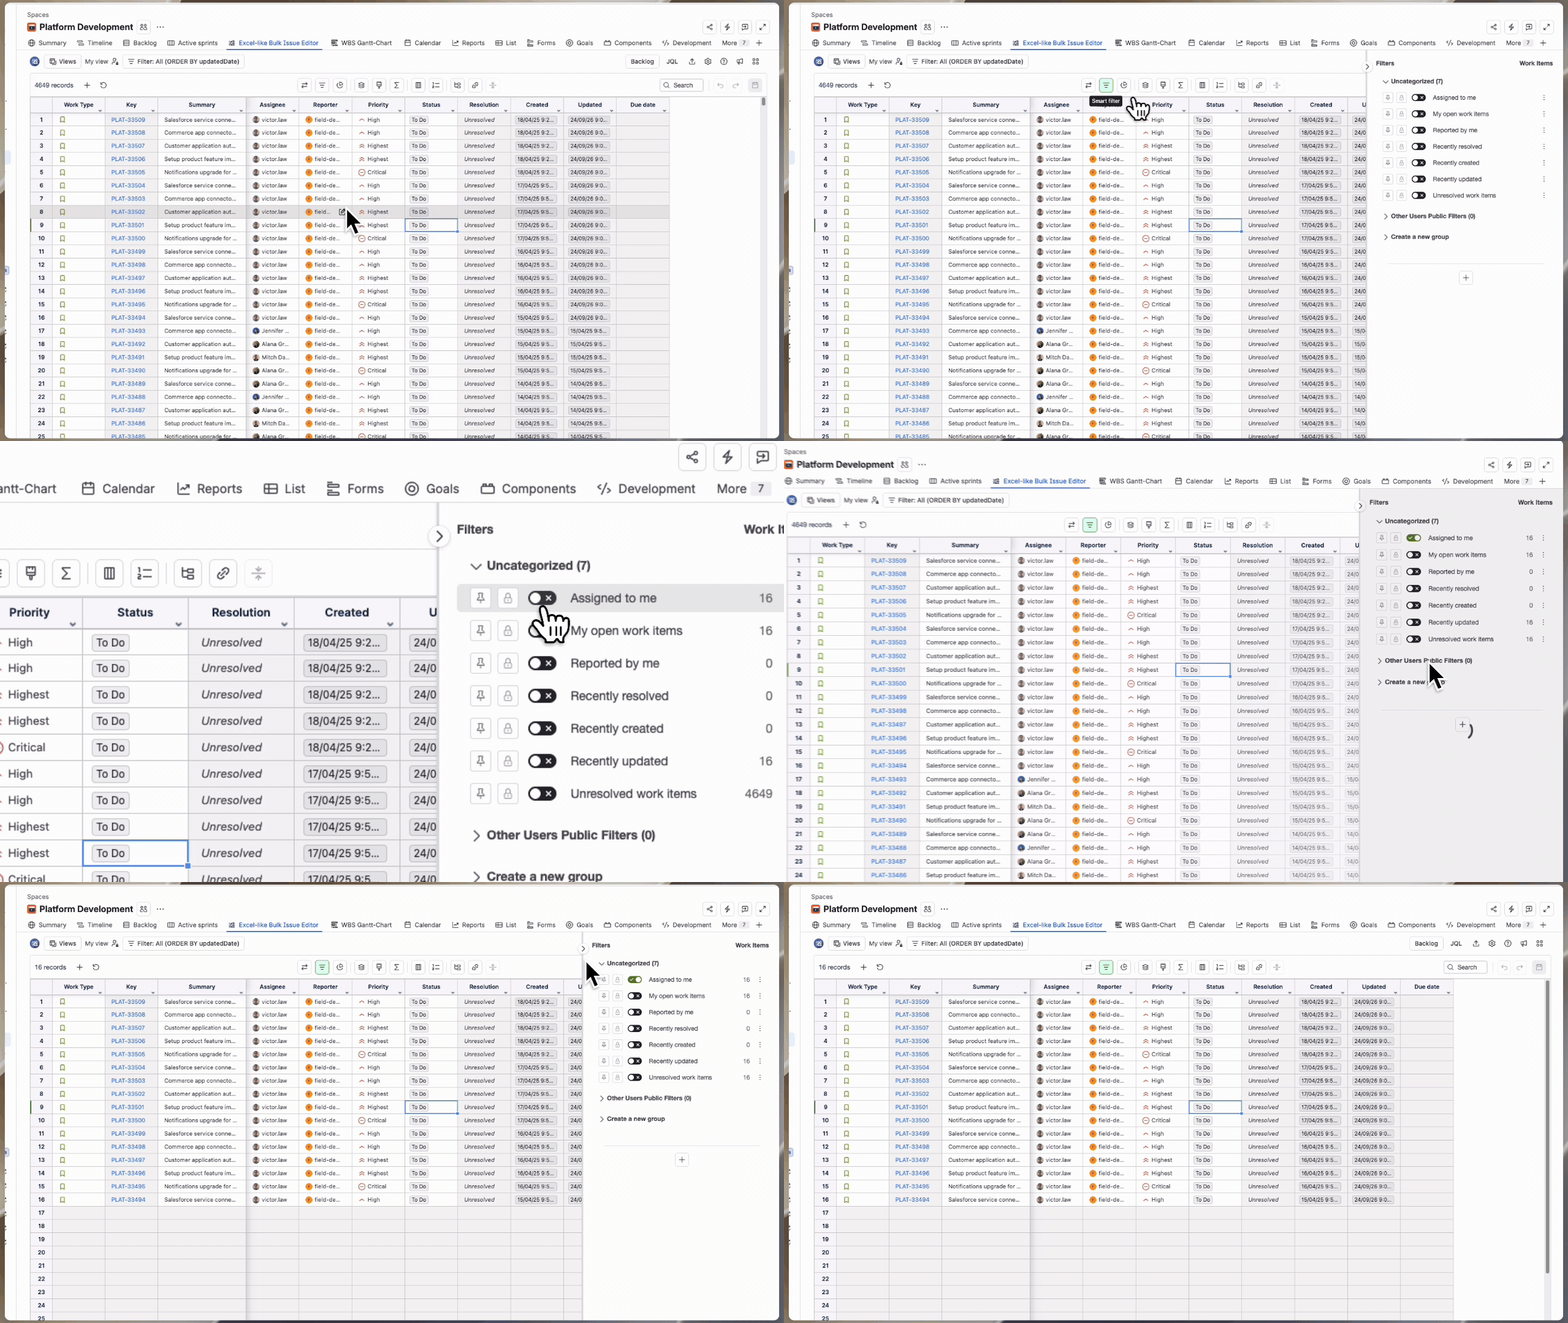
Smart filters enable users to apply filters on top of the JQL in their spreadsheet. These filters provide a quick overview of the total number of issues, and clicking on them applies the smart filter to the main JQL query in the spreadsheet.
Click the lock icon to share the smart filter with any logged-in users in your Jira. A smart filter shared with other users shows a globe icon.
Smart Filter Quick Toggle Bar
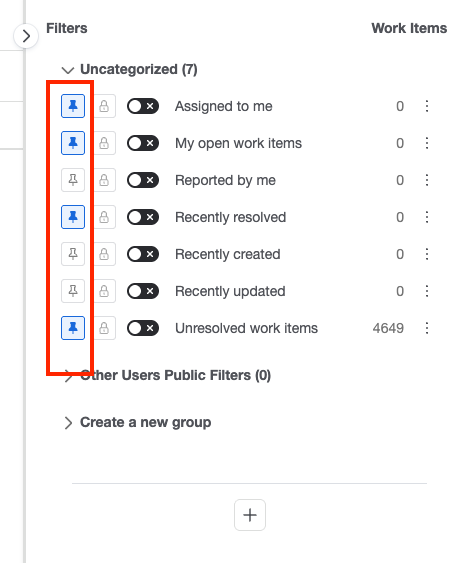
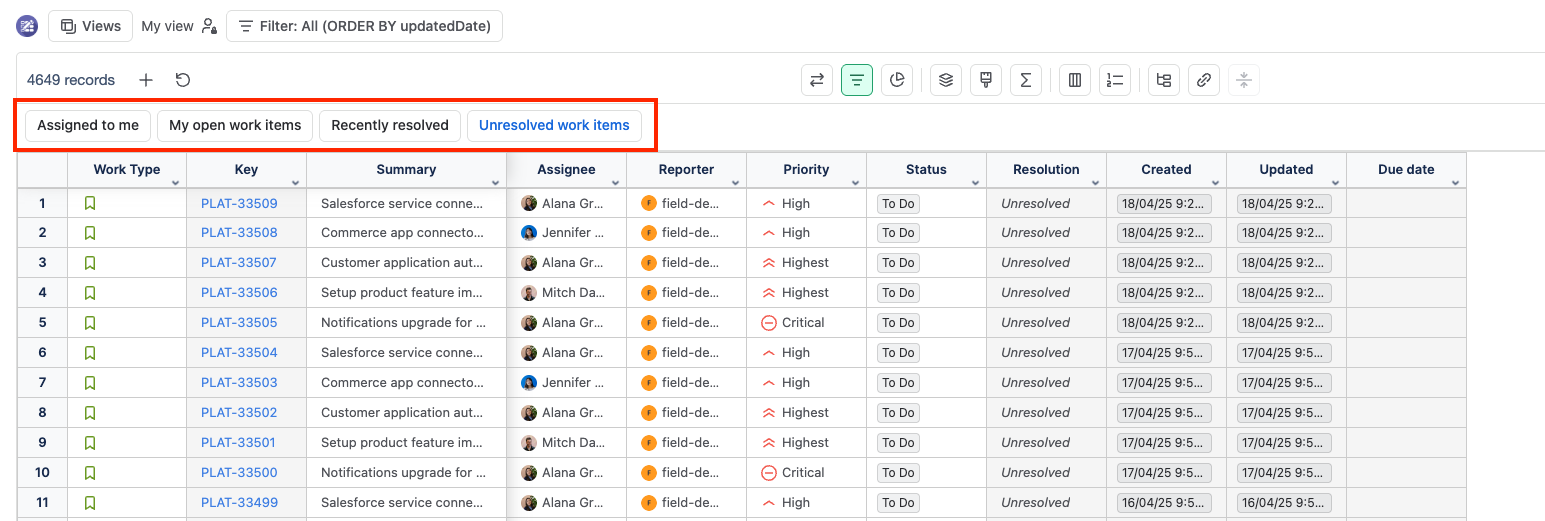
The Quick Toggle Bar lets you pin your most-used Smart Filters above the spreadsheet table in spreadsheet view, allowing you to activate or deactivate filters with a single click.
How It Works
-
Pin a Smart Filter
-
Click the Smart Filter icon in the top toolbar to open the side panel.
-
Click the Pin icon next to any filter you want quick access to.
-
The pinned filter will appear as a button on the Quick Toggle Bar above the issue list.
-
You can pin up to 6 Smart Filters to the Quick Toggle Bar.
-
Toggle Filters On / Off
-
Activate: Click a pinned filter button on the bar. The button highlights and filters the table instantly.
-
Deactivate: Click the active button again to remove the filter.
-
Combine: Click multiple buttons to apply multiple filters simultaneously.
-
Unpin a Filter
-
Open the Smart Filter side panel and click the Unpin icon on the filter.
-
Refresh
Using the refresh button saves users time by pulling the latest data into the current spreadsheet. If multiple users work on the same spreadsheet, load the latest data before making changes.

Create Multiple Issues
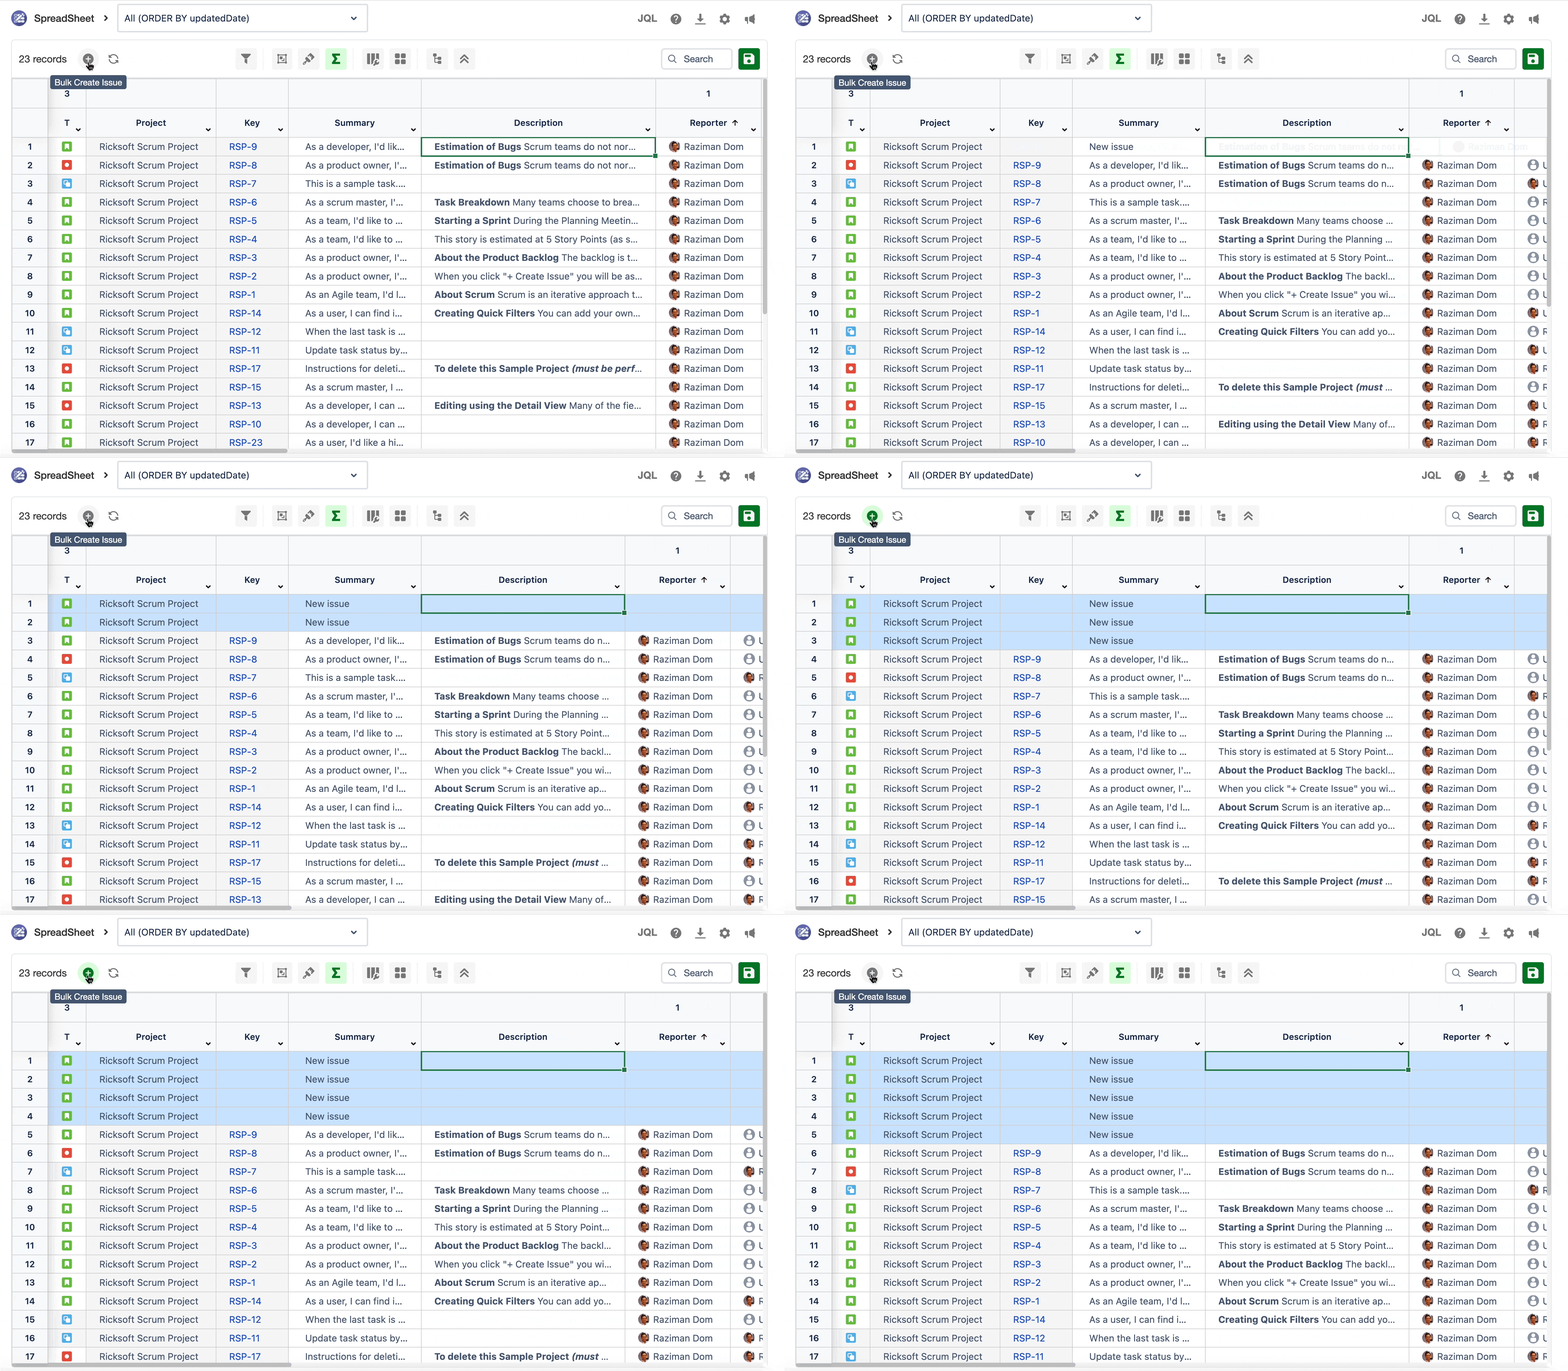
Our bulk create issues feature eliminates multiple steps when creating new issues in Jira. Users can leverage this feature to create multiple issues directly on the spreadsheet at once, streamlining the process and saving valuable time.
Find and Replace

Use this feature to search for a value and replace it with another one. Because of the various data types and several Jira restrictions, this function supports only certain data types.
Watch the demo on LinkedIn.
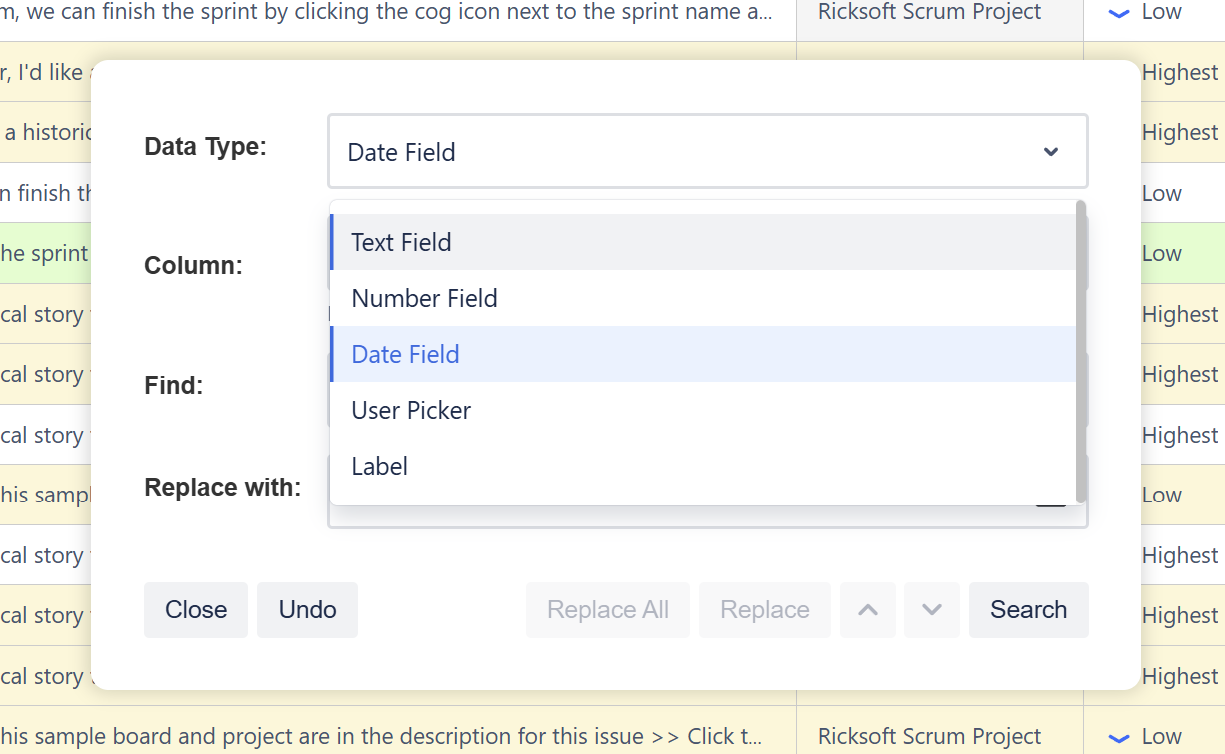
List of supported data types:
|
Data type |
Support |
|---|---|
|
Text |
Supported |
|
Number |
Supported |
|
Date |
Supported |
|
Date time |
Not supported |
|
User picker |
Supported |
|
Label |
Supported |
|
Component |
Not supported |
|
Status |
Not supported |
|
Radio |
Not supported |
|
Checkbox |
Not supported |
|
Single select list |
Not supported |
|
Multiple select list |
Not supported |
Undo and Redo
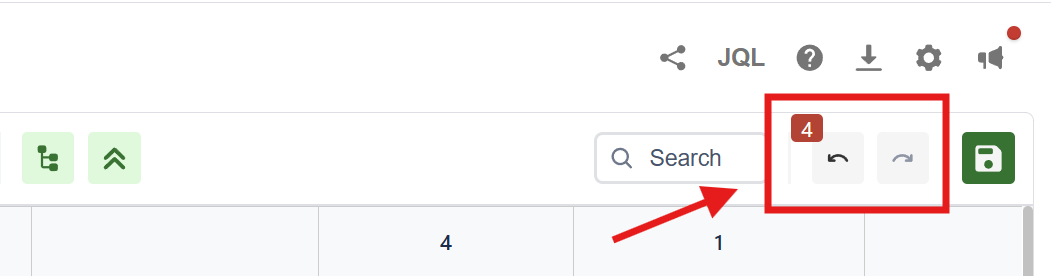
Changes you make to your spreadsheet won't apply to Jira instantly. This gives you the flexibility to undo and redo your changes on the spreadsheet.
Once you’re satisfied with the changes, click Save. After you save, you can no longer use the undo and redo buttons.
Chart
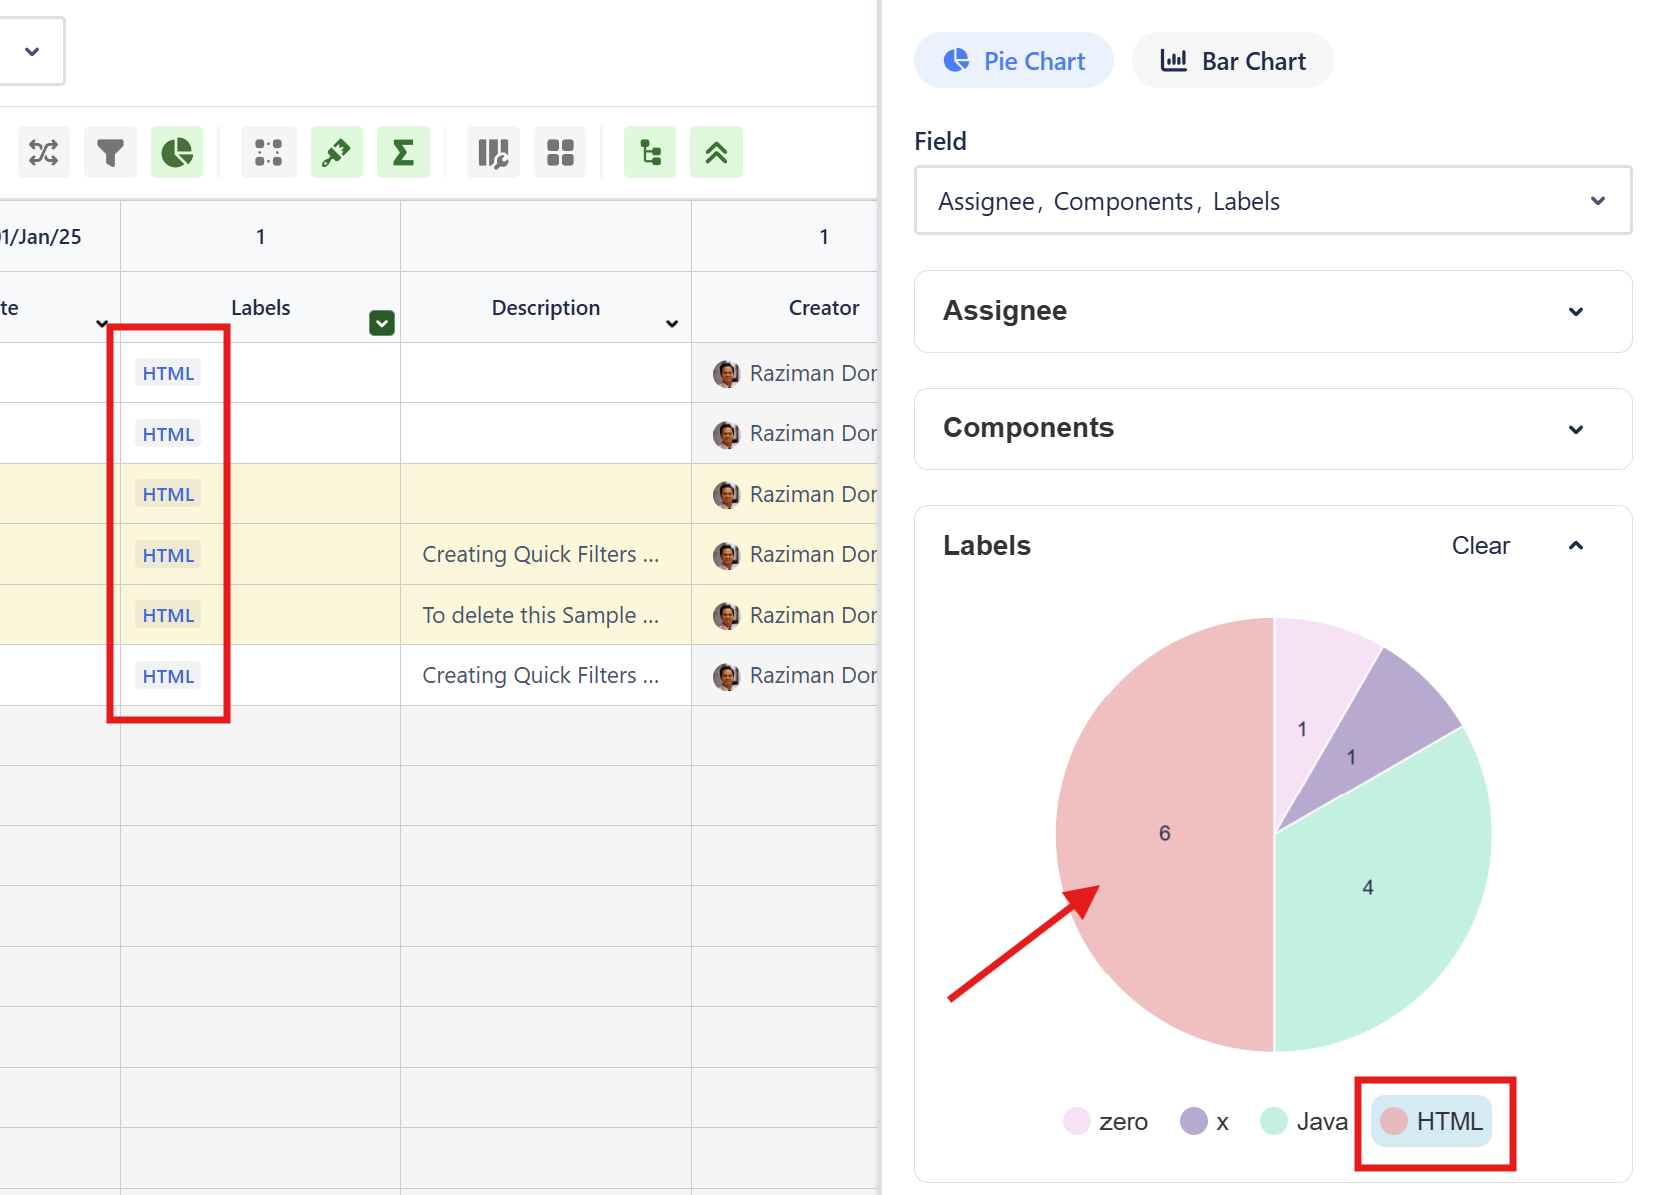
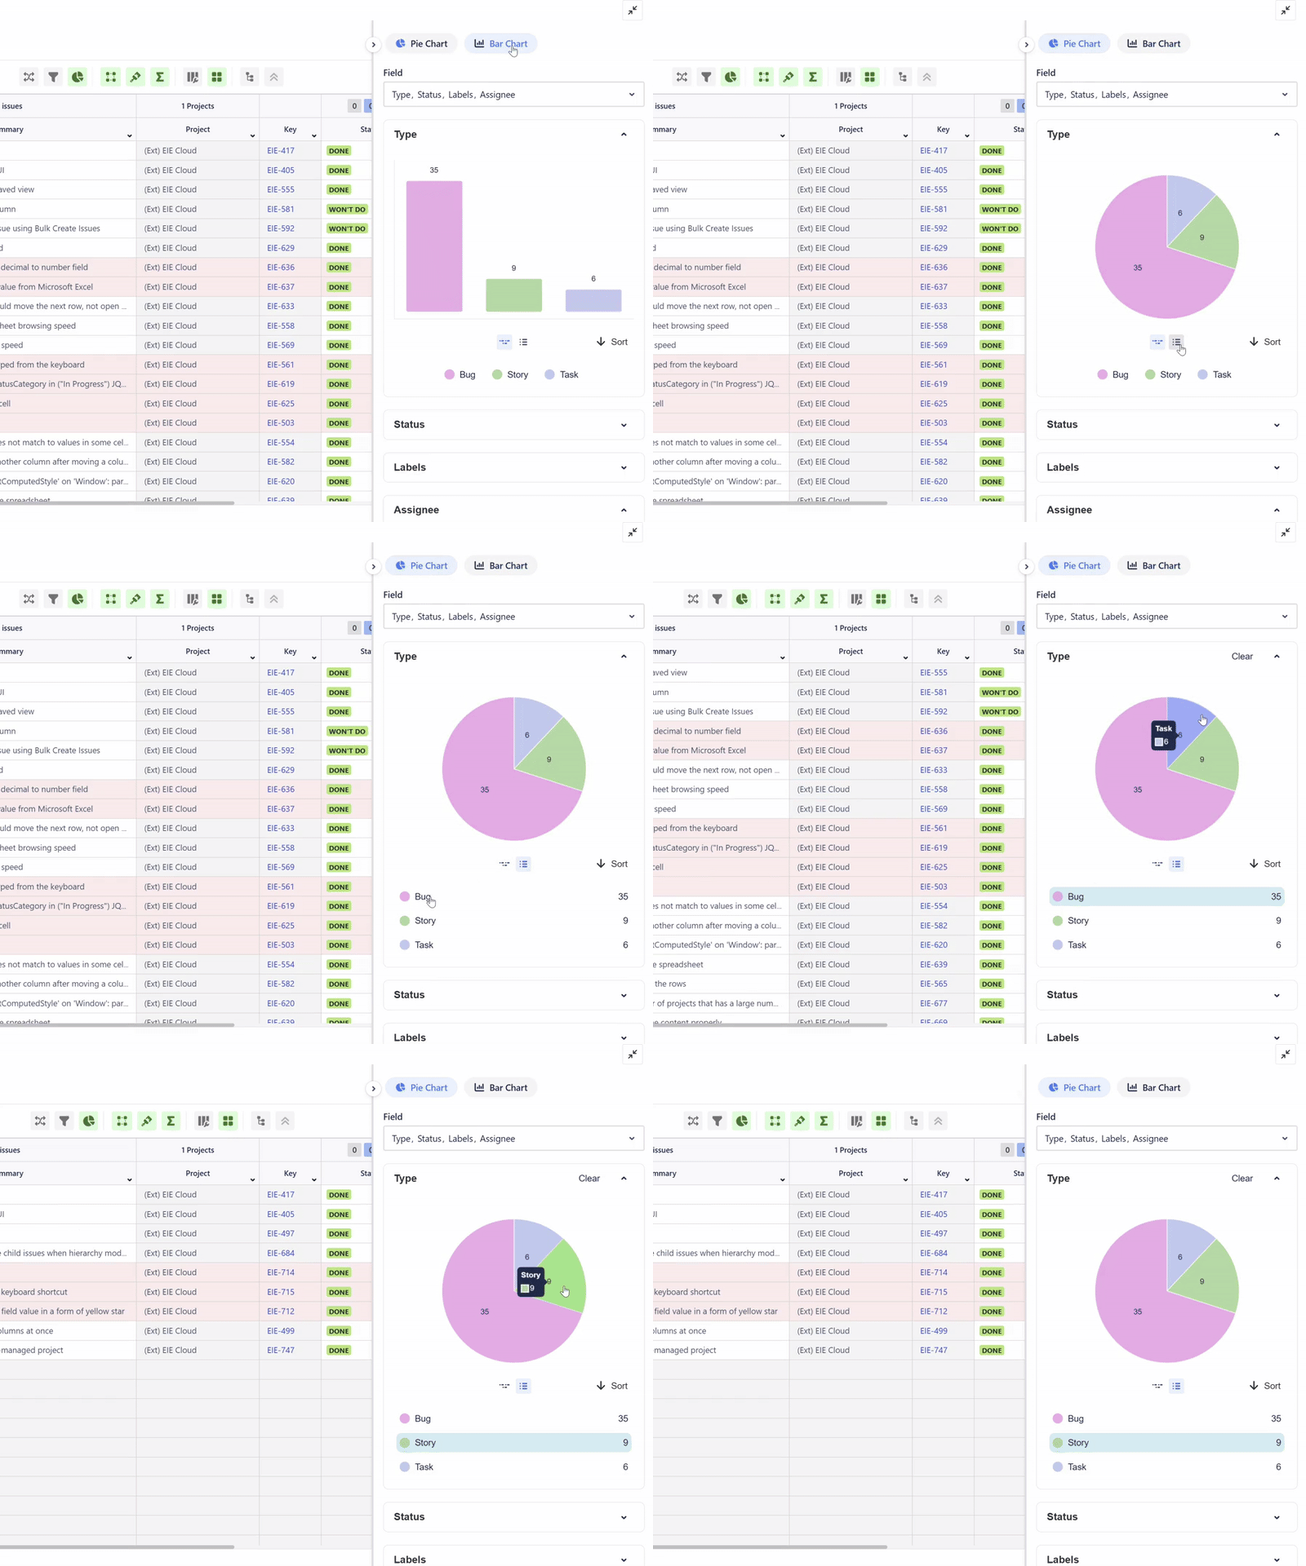
You can generate a pie or bar chart of the columns that you added to the spreadsheet.
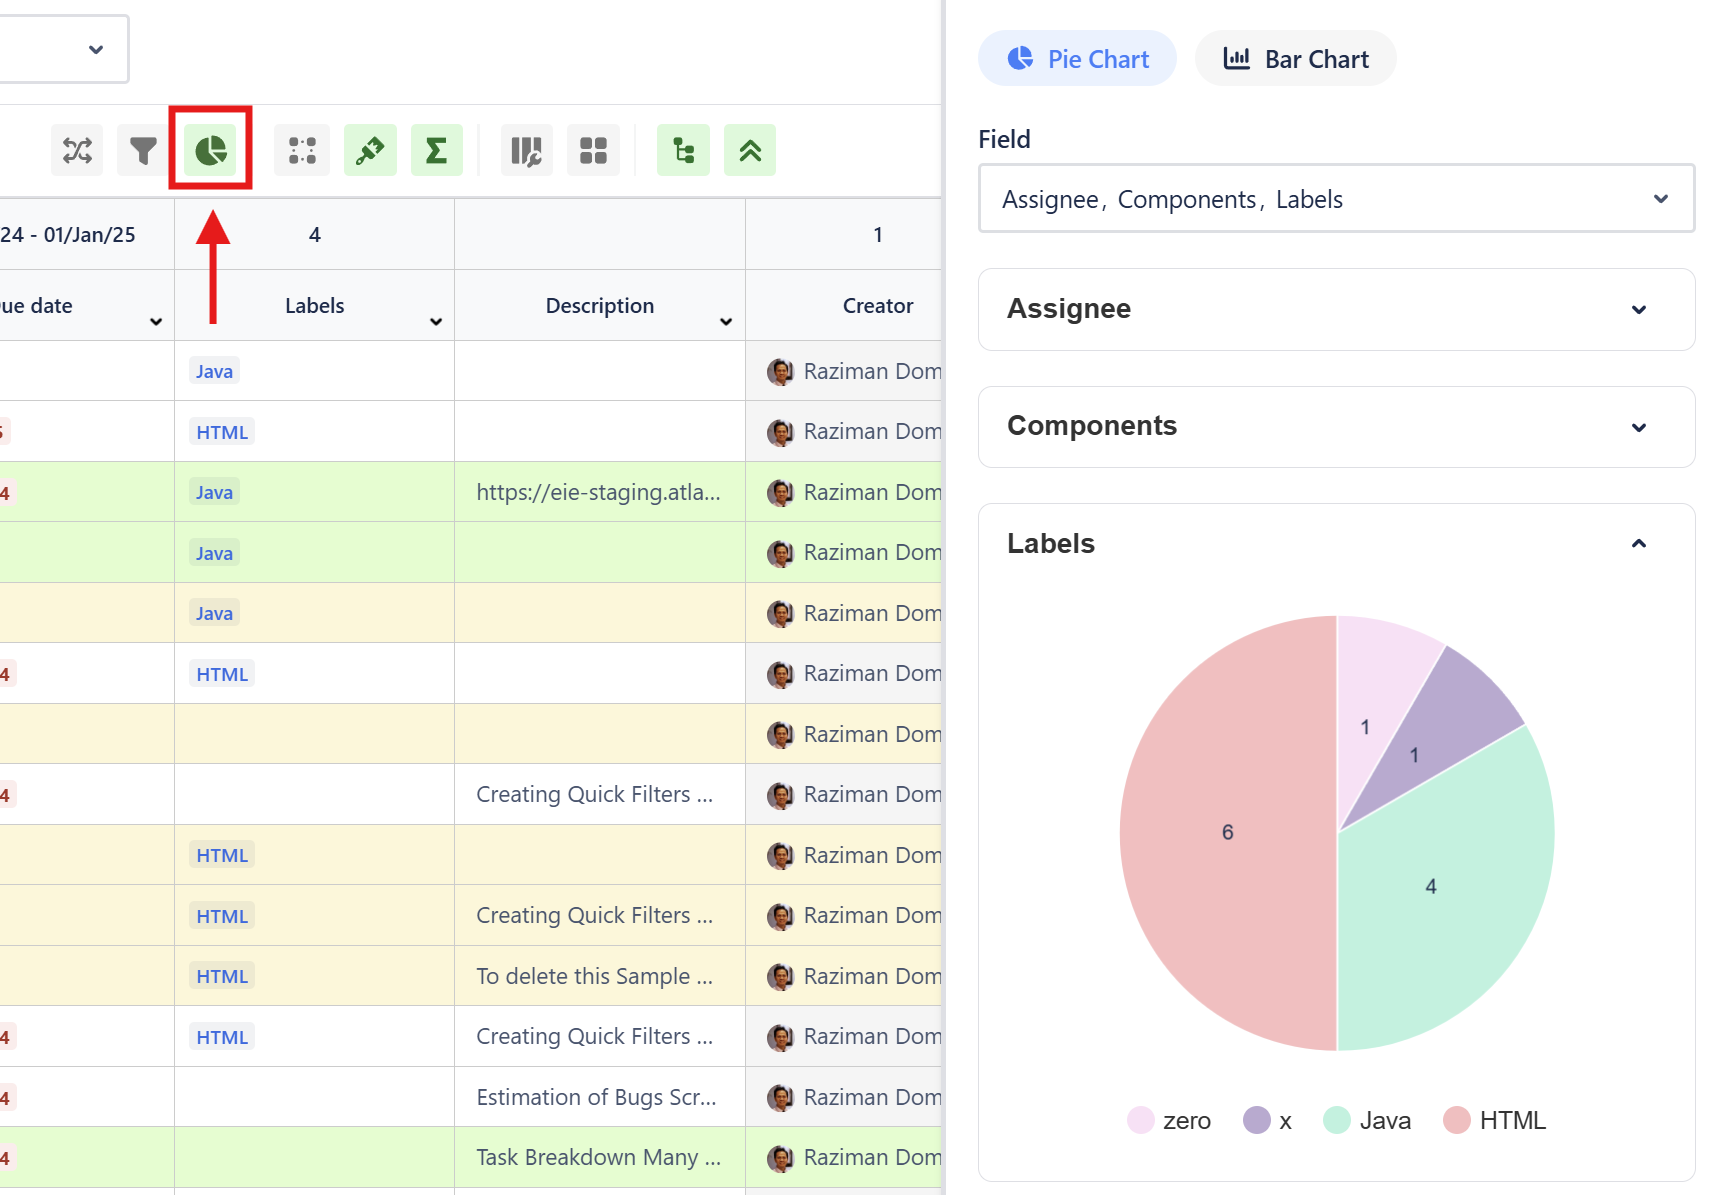
If you click the chart, the spreadsheet will filter to the selected value. In this example, we clicked HTML on the pie chart to look for issues with Labels ‘HTML’.