Check Resource view in View on the operations bar. The resources view is displayed on the WBS display and in Gantt chart format.
In the resources view you can display a list of assignees, as well resources bars showing time periods horizontally and % workload (units) vertically. A red line (called a 'limit line') indicates the maximum daily workload.
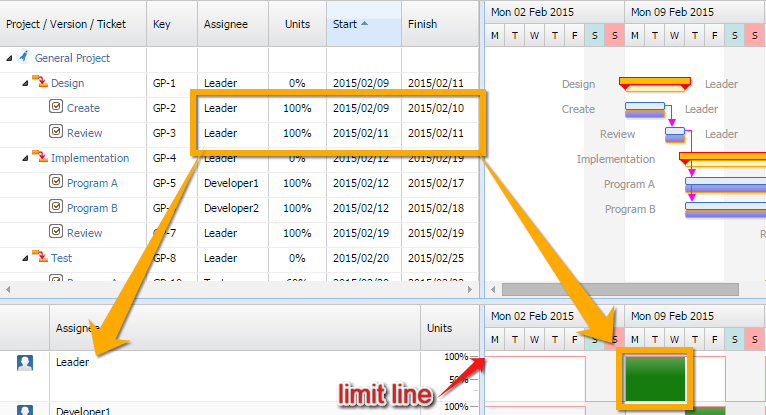
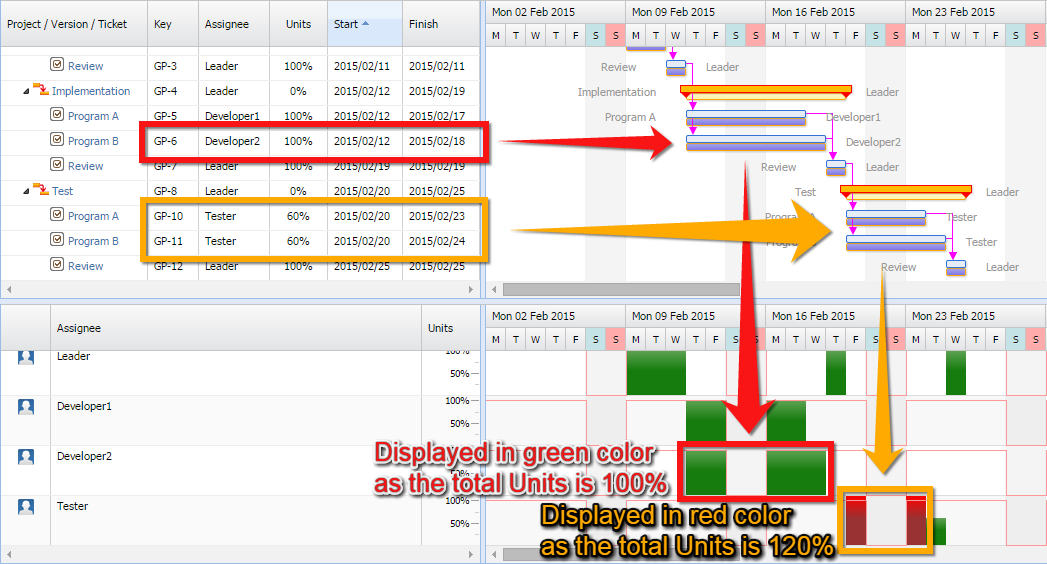
The resource bar is displayed in green if an assignee's workload units are below or in line with the limit line. If the workload units exceed the limit line, the resource bar will turn red. This indicates that the resources plan needs to be reviewed.
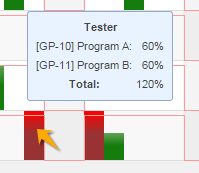
If you move your cursor onto the graph in the resources view, the issues to which the resources are allocated during that period, and their respective workloads, are displayed in a list.
Please note this version contains the following bugs.
-
Issues which do not have planned finish dates set are not displayed in the resources view.
-
If there are consecutive resource bars with the same total workload, the resource view tooltip displays the issue list for the first period only.
Default Values of Units
Initial values of workload units depend on how the issues are created.
-
Issues created from projects or versions -> 100%
-
Issues created from issues or issue template -> same value as the original
-
Issues created in Jira -> 100%
Also, when updating from WBS Gantt-Chart for Jira 7.9.1, or earlier, existing issues will have 0% workload units.