Timeline markers
Gantt charts display timeline markers for the project start, project end, and the current date by default. In addition to these, you can add timeline markers. This allows you to highlight specific important dates or milestones, providing a more accurate understanding of the project's progress.

How to add timeline markers
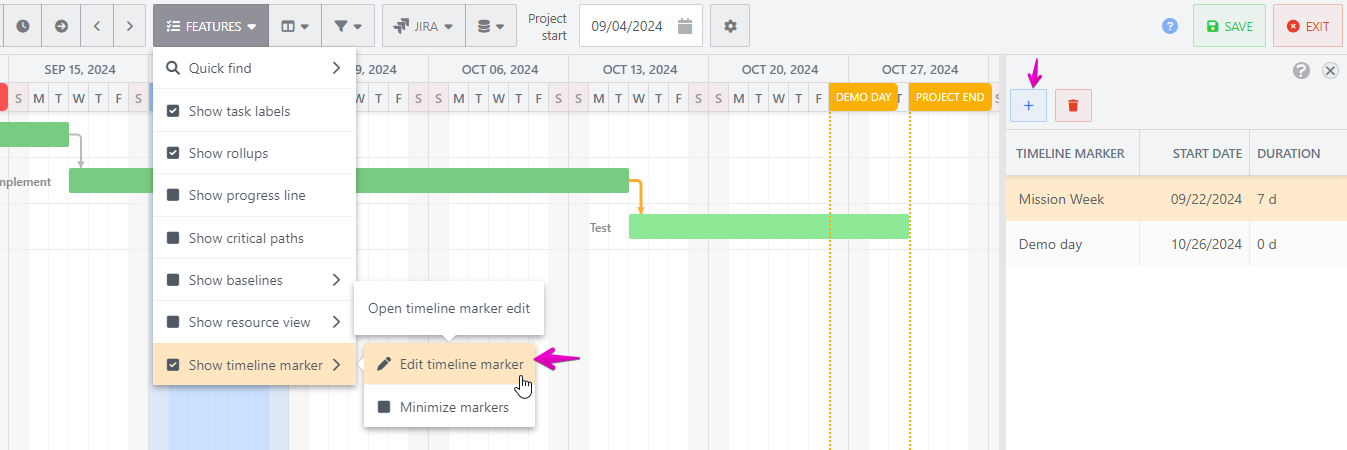
Click on "Edit timeline marker" in the Features menu.
The timeline marker editor panel will appear, and you can add a timeline marker by clicking the "+" icon.
By double-clicking on a cell, you can change the marker's name, start date, and duration.

