If you need to present a consistent Gantt chart view for different stakeholders, simply configure the default view. It lets you retain the columns & filters, Gantt features, and timeline displayed on the Confluence page.
Default view setting is only applicable to view mode. Once you open the Gantt chart editor, you’ll see the restored state from the last saved view.
How to set the default view state of columns and features
-
Open the Gantt chart editor and open the configuration panel
-
Select
Default Viewtab -
Update the setting and save your Gantt chart
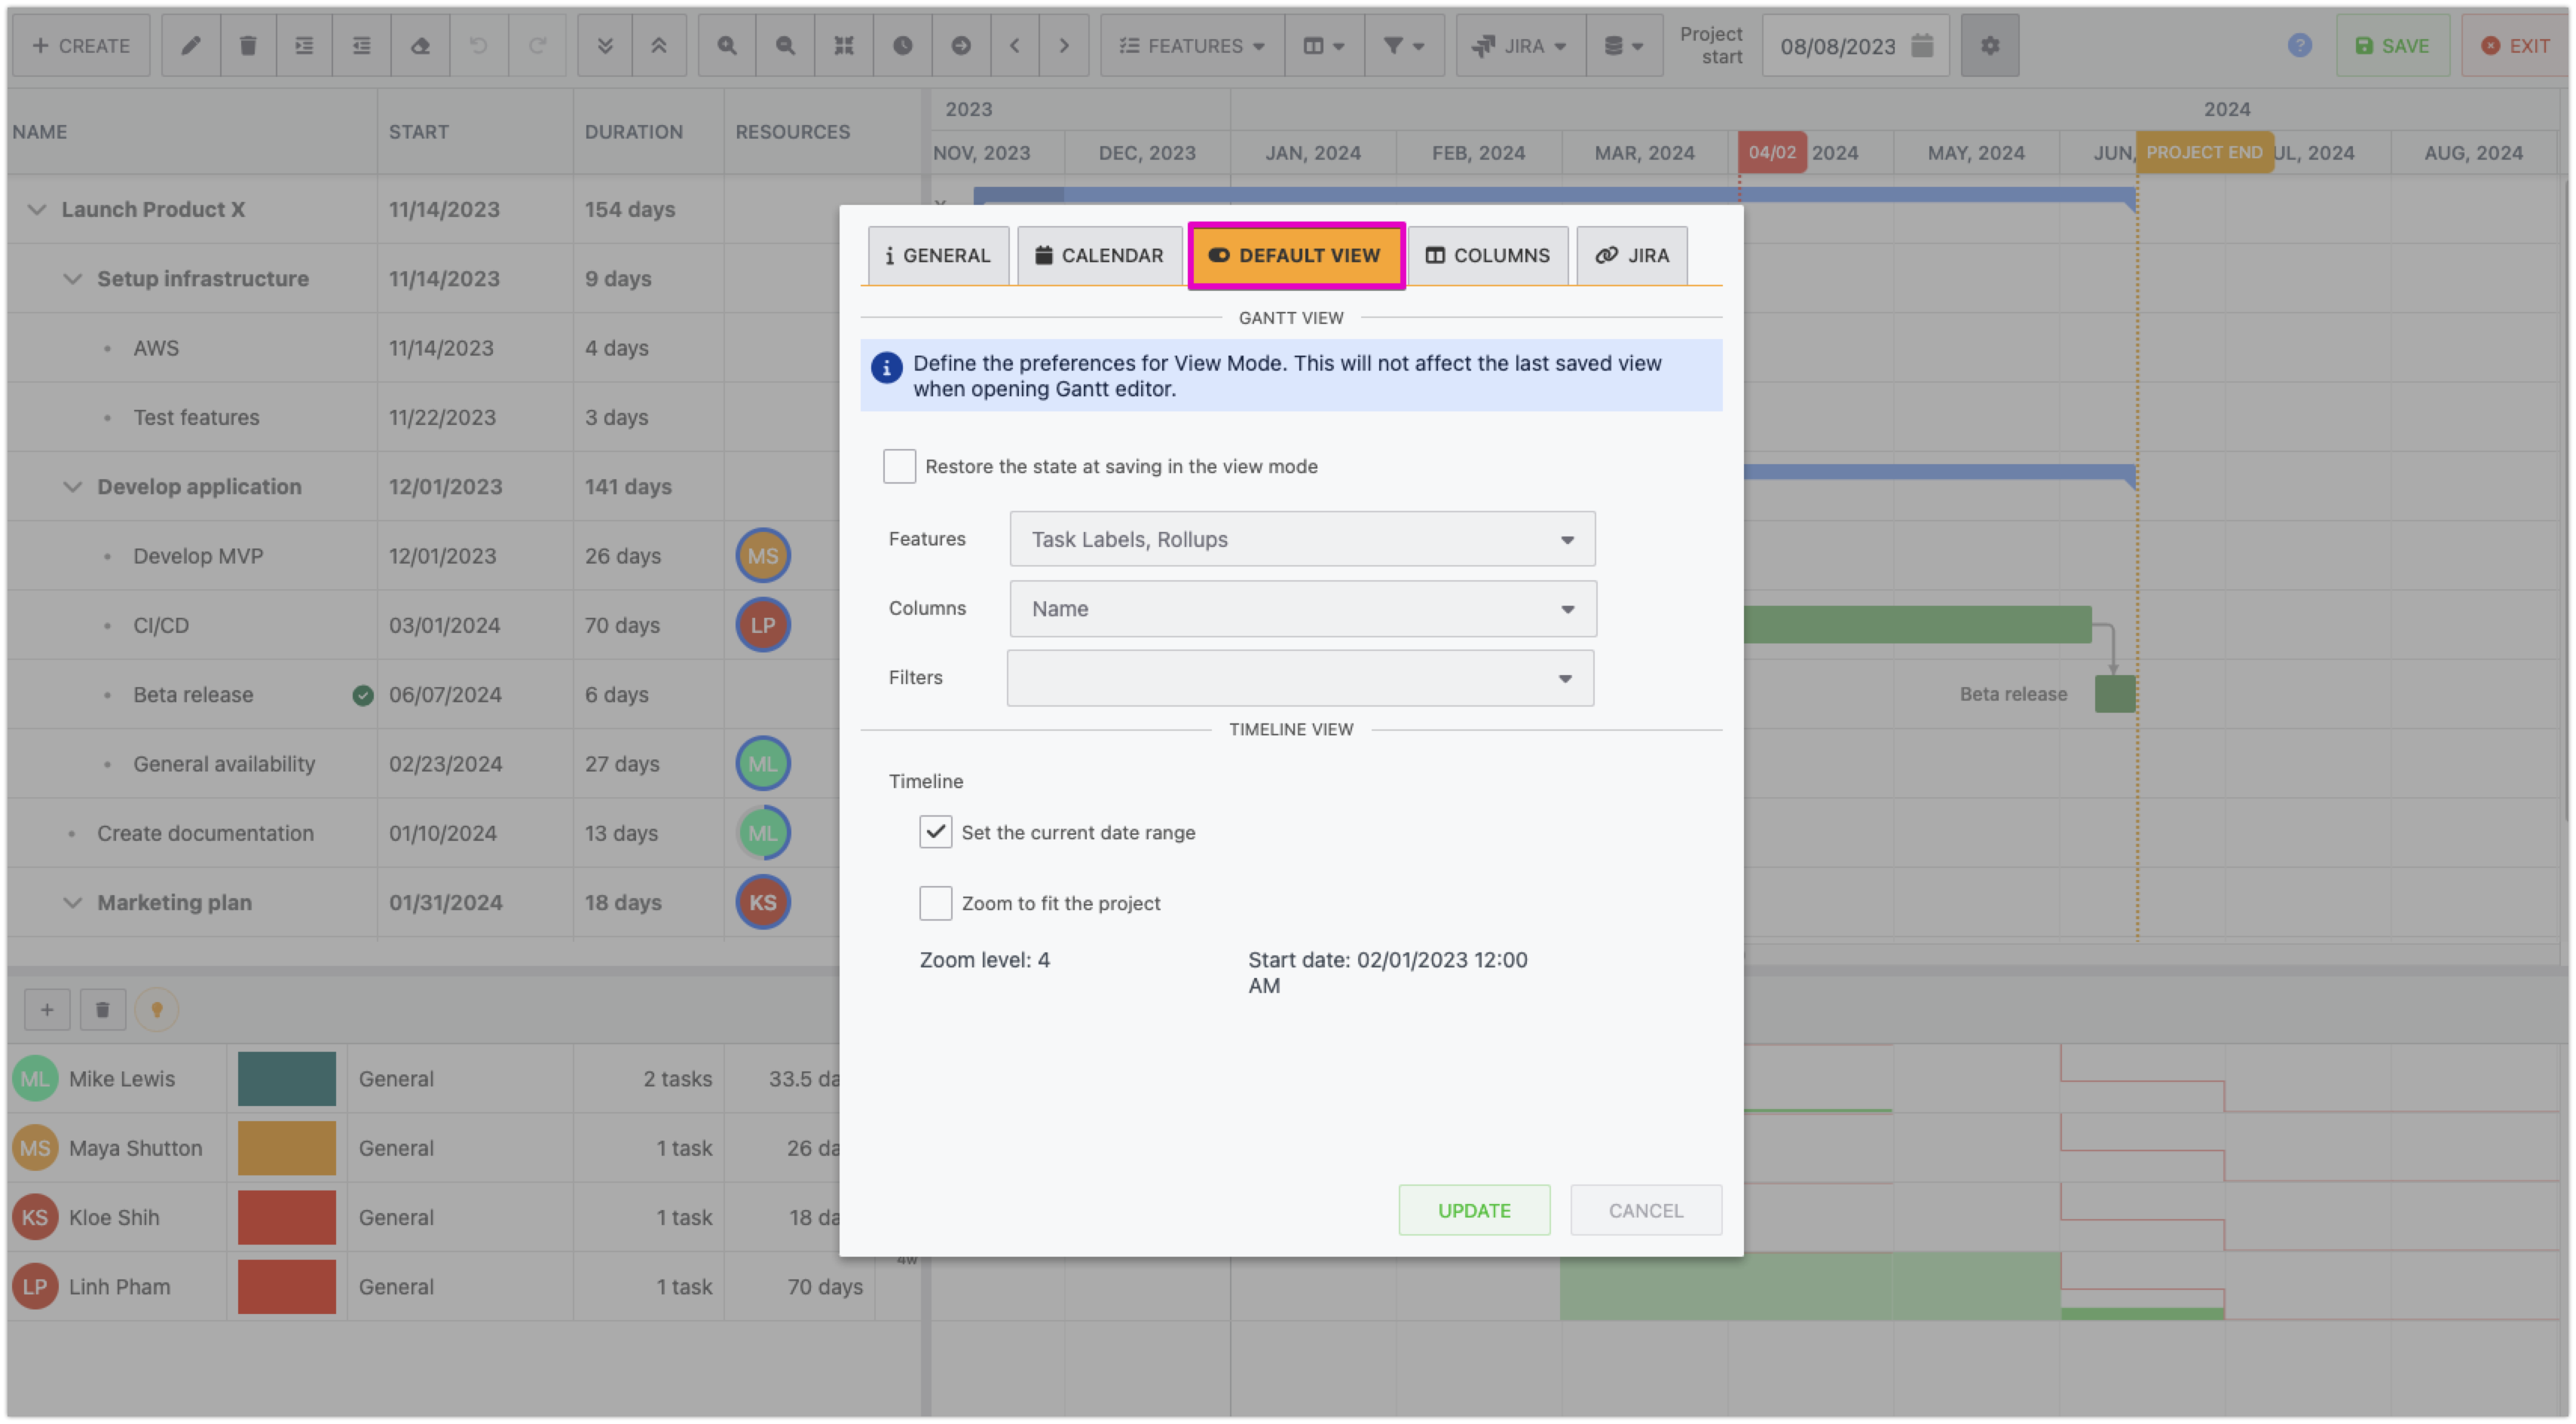
If you want to restore the view state in the view mode to the same as the edit mode, check “Restore the state at saving in the view mode“ option.
Gantt view
|
Features |
Select Gantt chart features that you want to display in view mode 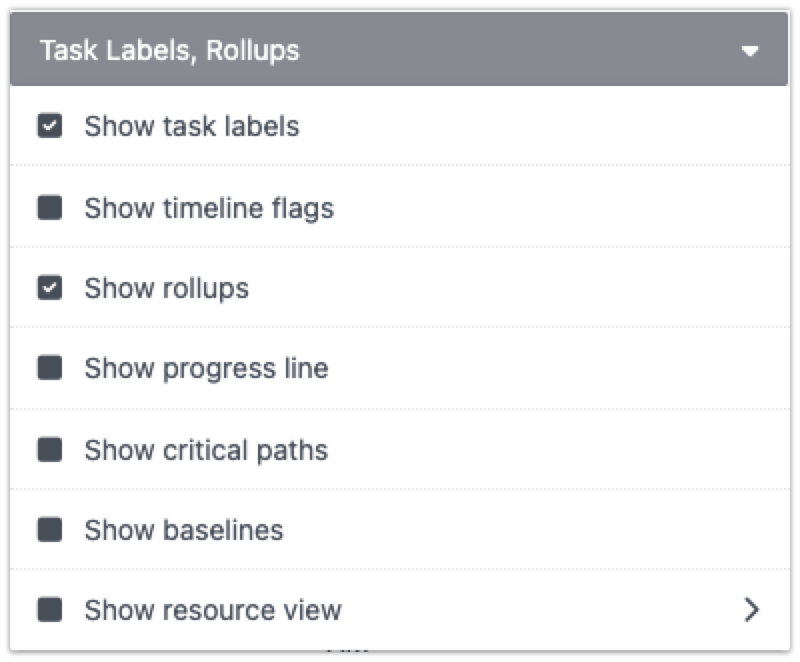
|
|---|---|
|
Columns |
Select column (fields) that you want to display in view mode 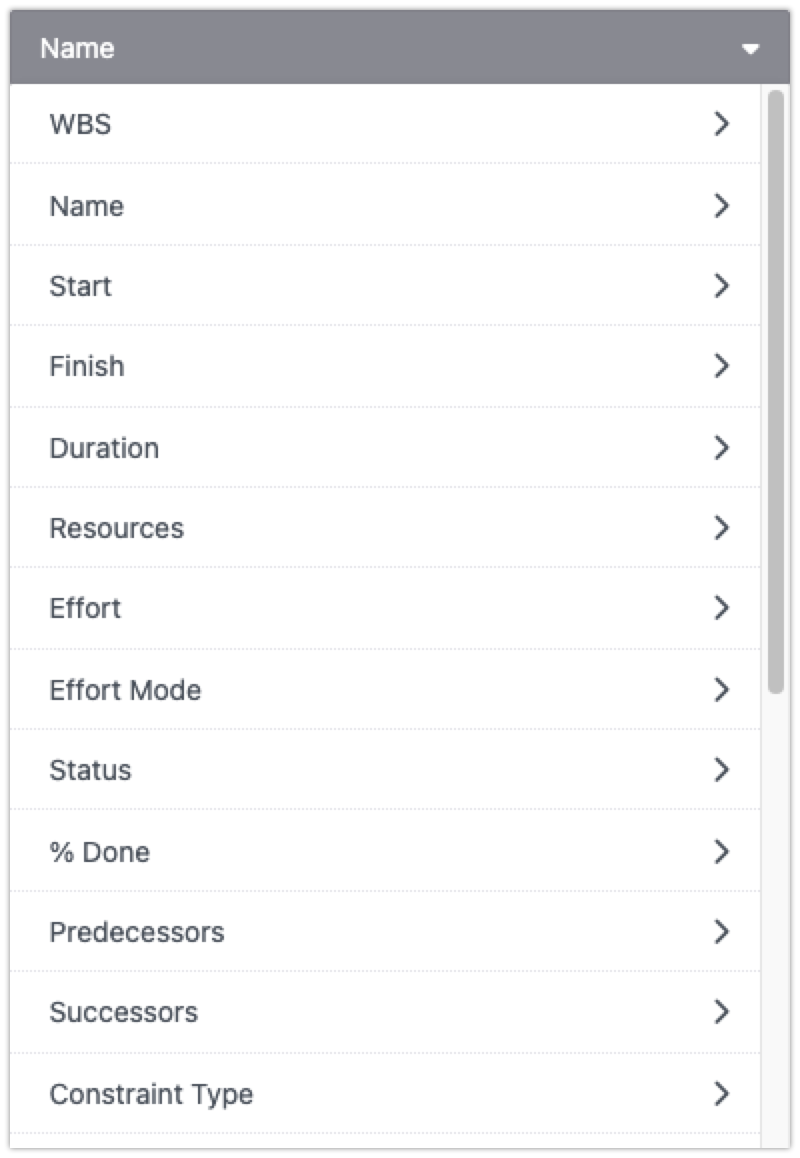
|
|
Filters |
Display specific tasks in view mode through saved filters Click on the field label to define your filter 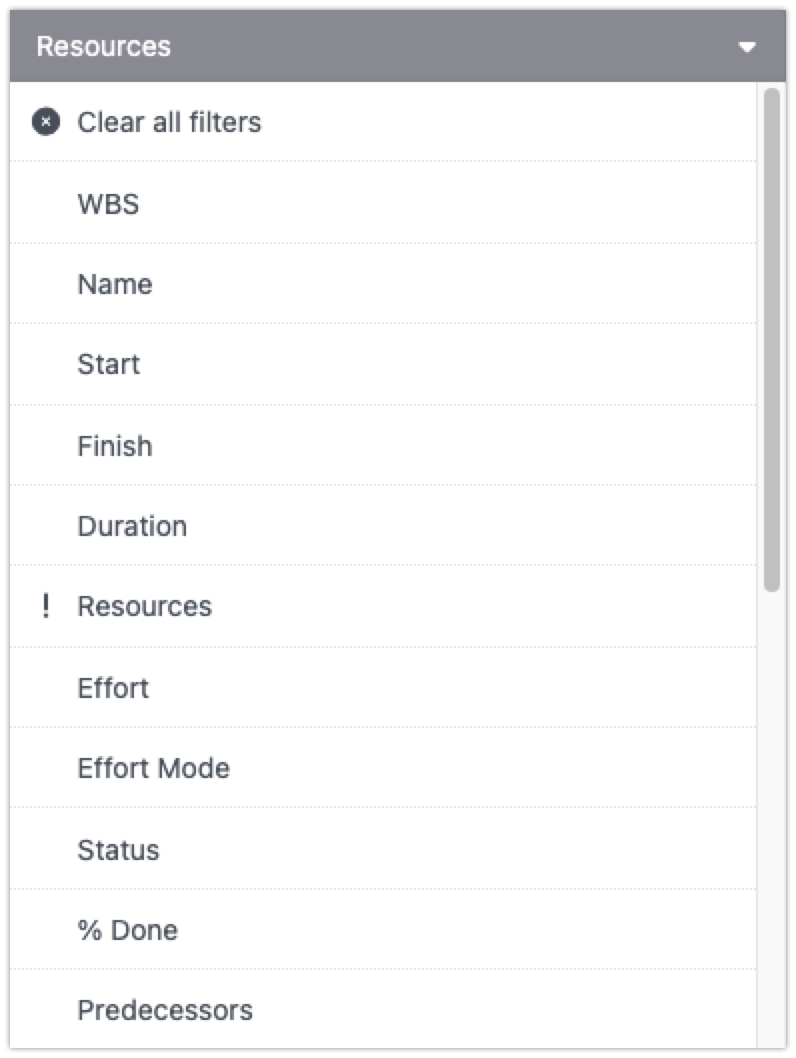
|
Timeline view
You can also set a default zoom level and date range for your Gantt project:
|
Set to current date range |
This option applies the same view as you set in edit mode 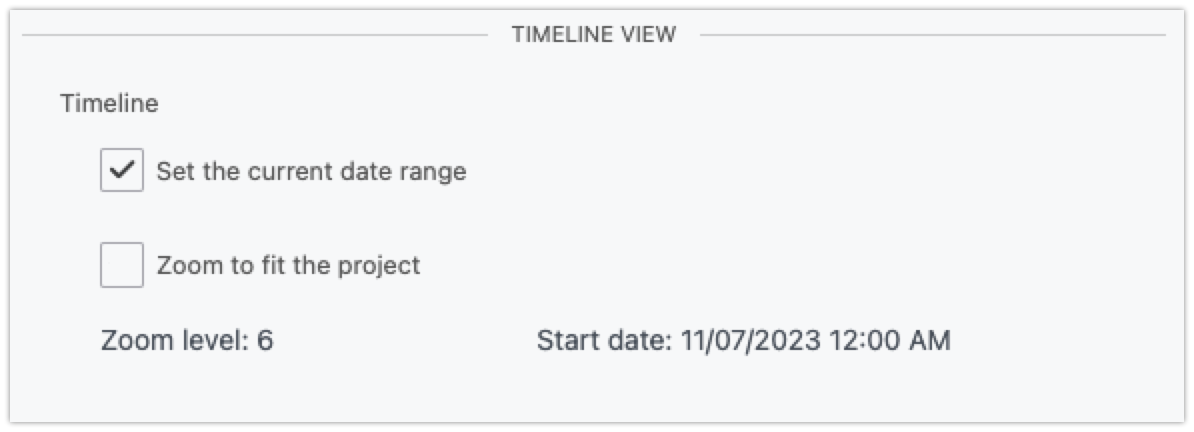
|
|---|---|
|
Zoom to fit the project |
This option automatically displays the Gantt timeline at the beginning of the project Ideal for showing projects with start date in the past 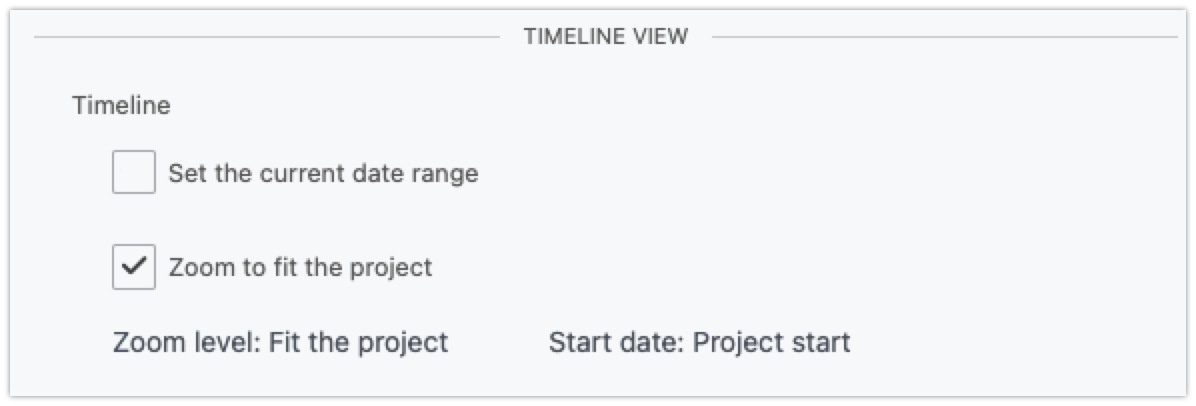
|